Stock Market Dow Trend Forecast for September to December 2015
Stock-Markets / Stock Markets 2015 Sep 13, 2015 - 04:45 PM GMTBy: Nadeem_Walayat
 The 15% drop in average stock prices during the past month has galvanised a growing number of bears to once more dig out ancient text book reasons for why this is the time for the stocks bear market to finally begin, and not only that but keep making definitive statements for the expectations for market crash's that always fail to materialise for the obvious reason that a crash is a panic event that can only at best be discerned no earlier than during the preceding day. Even then the probability would favour the market ending higher on the so called crash day because market crashes are NOT common events.
Nevertheless, the hefty stock market decline is providing ample ammunition for the bears to successfully convince an increasing number of retail spectators through a myriad of reasons such as falling corporate profits, shrinking balance sheets, rising debt mountains, deflation, the Fed ending QE, and of course the prospects for an imminent rise in US interest rates, and even Europe's refugee crisis is apparently an harbinger for the long awaited for mother of all stocks bear markets to begin, this despite having missed the bull run of the past 6 YEARS!
However, as I have often pointed out countless times that it is ALWAYS very easy to construct a bullish or bearish case for ANY market on the basis of anecdotes, because no matter how convincing the reasons are it is ALWAYS PRICE that is KING, much as I voiced right at the beginning of the Stocks bull market in March 2009 when it was beyond the comprehension of most to imagine how the stock market could enter into a bull market under the weight of overwhelmingly bearish fundamentals at that time.
15 Mar 2009 - Stealth Bull Market Follows Stocks Bear Market Bottom at Dow 6,470
Yes I am aware of the on-going corporate earnings contraction forecasts that SUGGEST stocks should be going MUCH lower, though some of the estimates of where the market should be heading to are pretty ridiculous, were talking ridiculous price levels of as low as DJIA 400! However the stocks bull market was also elevated to Dow 14,000 on the basis of corporate EARNINGS forecasts that suggested that Stocks should go MUCH HIGHER. So what does that tell you ? It tells you that what you tend to read is always suggestive of the JUNCTURE being FAR AWAY, NOT imminent. IT IS ONLY LONG AFTER THE FACT, AFTER MARKET'S HAVE ALREADY MOVED THAT THE JUNCTURE IS RECOGNISED AND ANALYSIS PRESENTED AS TO WHAT WENT WRONG WITH THE SCENERIO THAT CALLED FOR MUCH LOWER PRICES.
The only thing that actually matters is the PRICE ! NOTHING ELSE! and I mean NOTHING ! Not earnings, Not fundamentals. Listen to the PRICE or you WILL miss the Stealth Bull Market!
My message for the duration of this stocks stealth bull market has been very simple which is that the "greater the deviation from the bull market peak then the greater the buying opportunity presented". Therefore this analysis will once more seek to test this simple but powerful stocks bull market investing rule that has kept many investors on the RIGHT side of the bull market for over 6 years!
Existing Forecast for 2015
03 Feb 2015 - Dow Stock Market Trend Forecast 2015 by Nadeem Walayat
The Dow resolves to a bullish Elliott Wave pattern i.e. implies that the Dow should now embark on a trend to a new all time high, probably before the end of March! So contrary to much of the building picture so far. Thereafter suggests a summer ABC correction back down to around 17,500 to coincide with "Sell in May and Go Away".
Dow Stock Market Forecast 2015 Conclusion
My final conclusion is for the Dow to spend the first half of 2015 in a wide volatile trading range as it continues to unwind the 2014 bull run and sets the scene for the next series of bull runs to new all time highs. I expect the Dow to have started its bull run by early August off of an summer low and then continue into the end of the year, punctuated by an October correction low. I further expect the Dow to be trading well above 19,000 during December 2015 and probably above 19,500, before closing at around Dow 19,150 for a 7.5% gain for the year as illustrated by the following trend forecast graph for 2015.
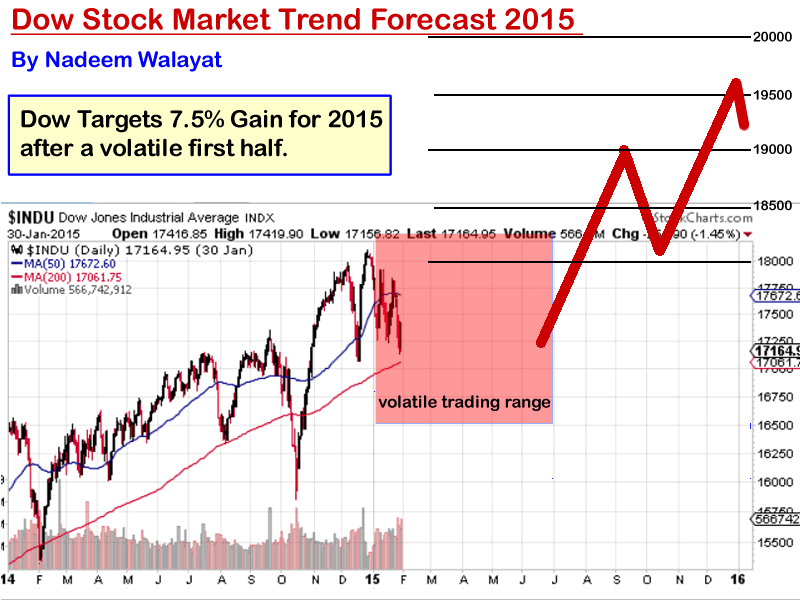
The stock market has been showing a significant deviation from the forecast trend for 2015 during the past few weeks, hence this in-depth analysis will seek to reappraise the prospects for the DJIA stocks index for the remainder of 2015.
China Stock Market Collapse
China's stock market meltdown that began Mid June from a SSEC trading high of 5,200 had paused under the weight of heavy the Chinese government interventions that in total amount to over $400 billion thrown at the stock market in an attempt to bring the selling to a halt. However, all of that literally went up in smoke along with one of China's largest ports which literally exploded revealing behind the truth of what the Chinese economy is, a mere mirage of the picture of strength and stability that communist party propaganda has been successfully propagating.

My recent update for my long standing prospects for the Chinese stock market reiterated expectations for a spike low to approx 2,500 before the Chinese stocks bull market once more resumed towards levels that are unimaginable today i.e. that a decade from now the chinese stock index could triple from its recent low.
27 Aug 2015 - China Stocks Bear Market Crash, Are We Near the Bottom Yet?
China Stock Market Bottom?
In terms of my current expectations for the Chinese stock market then I refer to my in-depth analysis of mid July that as of SSEC 3877 forecast a resumption of the bear market to a target spike low of SSEC 2,500:
13 Jul 2015 - China Crash, Greece Collapse, Harbingers of Stock Market Apocalypse Forecast 2015?
China Stock Market Forecast Conclusion
Pulling all of the threads together implies that the current rally is corrective, following which the SSEC bear market looks set to resume with a vengeance with the SSEC targeting 2,500! Which is quite some distance from its last close of 3877.
As for what happens after SSEC 2,500 is less clear, I am leaning towards probability favouring a dip to 2,500 being a panic spike that soon reverses higher and resolves to base building between 3,000 and 3,500 for the remainder of 2015. However, if the spike low rally fails then that could yet trigger FURTHER panic that plunges the SSEC into a deeper trading range of 2,000 to 2,500 for several years.
So the bottom line is that there is far worse to come for China investors. In fact the china bear markets only about half done!
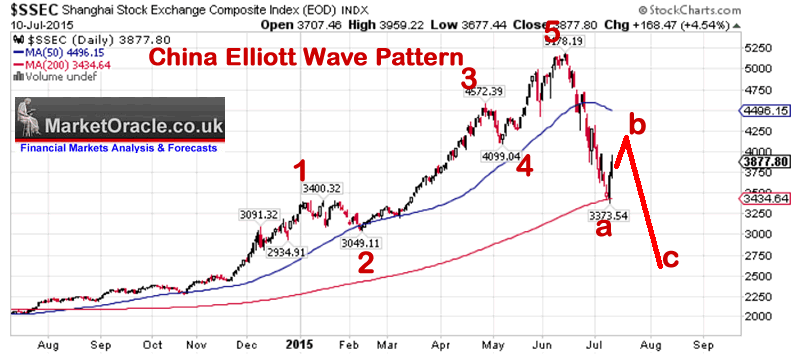
Since when the SSEC has fallen by nearly 1000 points or 25% and is now within touching distance of the target low from which the SSEC could carve out a bottom. Recent trading volatility suggests that when the low comes its going to be pretty quick (as originally forecast) i.e. the final spike low could occur over just 1 or 2 trading days rather than a laboured bottom forming process, with the SSEC likely quickly rallying to back over 3,000 (+20%) and unlikely to revisit the SSEC final low again.
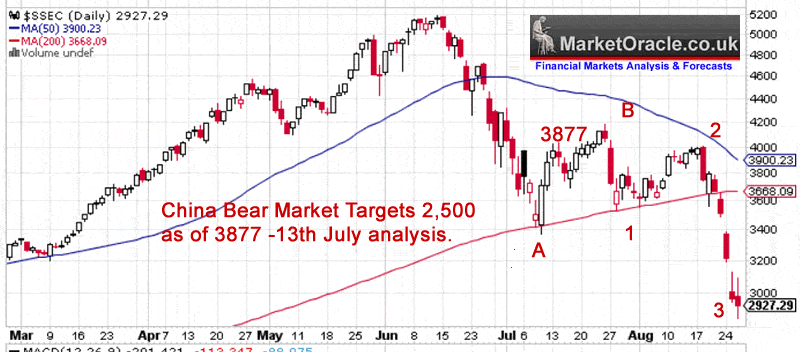
The immediate technical picture of a deeply oversold, down 23% in just 5 day, and the elliott wave (A-B-C) pattern implying an imminent bounce before the SSEC final spike low. So the SSEC should trade higher over the next few days before likely spiking lower once more.
The bottom line is that the China stock market IS NEAR a bottom, and that it could even all be done and dusted within a week or so!
China Stock Market Current State
The always imminent doom, collapse, catastrophe has so far FAILED to materialise as evidence by the Chinese stock market holding its own these past few weeks because fundamentally China is not collapsing instead it is CHANGING, changing from an exporter to a consumer and thus we are seeing re-rating of heavily bid up stock sectors in the heavily manipulated Chinese stock market as the smart money cycles out of contracting businesses into the future trends of domestic consumption such as tourism and leisure.
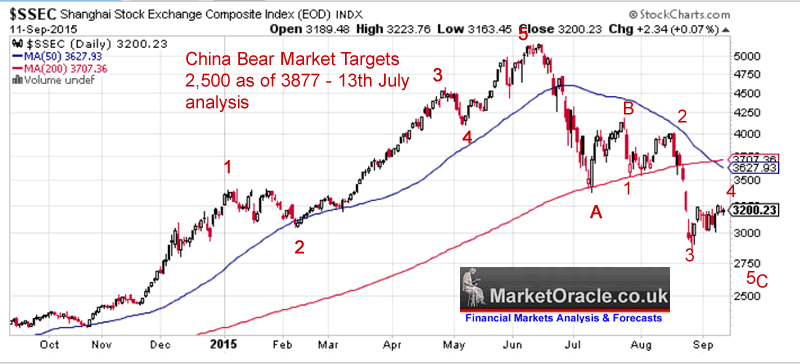
In terms of where the SSEC is headed, elliot wave theory implies that the SSEC is due another leg lower to complete its fifth wave of the C wave down leg towards the 2,500 target timed to to complete by the end of September.
Implications for Western Stock Markets
A resumption of the Chinese bull market coupled with greater local consumption should see those sectors that SUPPLY China with finished goods and services prosper, whilst the raw material and outsourcers are likely to suffer due increasing domestic costs such as wages and a contracting local industrial base that at least in part relocates elsewhere, perhaps to India or Malaysia or Indonesia and maybe some day Russia if it gets its act together.
Therefore on a fundamental basis when the dust from the widespread China collapse FEAR commentary has settled then Chinese continuing economic expansion should continue to contribute towards corporate profits for many western internationals and thus be trend positive.
In terms of the immediate future, continuing weak Chinese stocks trending towards their final low will act as a drag on western stock markets which implies the likes of the Dow will be kept under pressure going into Mid October or so.
The Crude Oil Price Collapse 2015
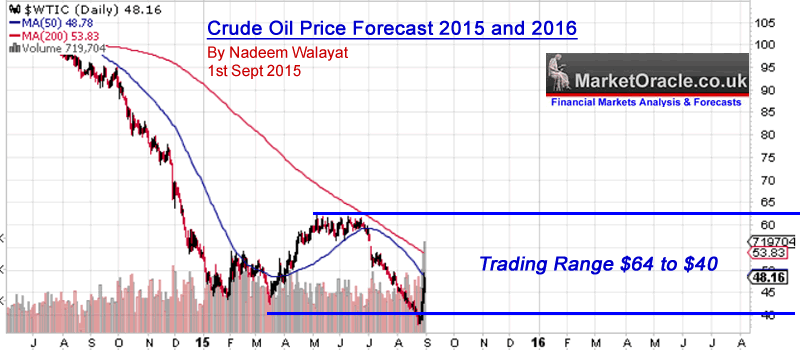
The crude oil price has relentlessly trended lower all year to an unimaginably low price low of $37 of just over a week ago, falling from $100 a year ago. The severe bear market has not only caught many market commentators off guard but has had a devastating impact on several major economies that are heavily reliant on high oil prices such as Russia, the gulf states, and other emerging markets reliant on their energy sector tax revenues to finance state spending and of course Britain's very own Scotland that a year ago was toying with idea of committing social and economic suicide (independence referendum).
My last in-depth analysis focused on the prospects for the crude oil price into Mid 2016 and concluded in trading range forecast of between $64 and $40 as excerpted below:
01 Sep 2015 - Crude Oil Price Forecast 2015 and 2016
Crude Oil Price Forecast 2015, 2016
Whilst it is highly probable that my original forecast low of $36 has now been achieved at $37.75. The over riding message from this analysis is that the crude oil price looks set to enter into a prolonged trading range of approx $64 to $40 for the next 12 months. Therefore my forecast conclusion is for crude oil to trend higher in the immediate future to the upper end of this trading range before turning lower and to remain within this trading range for another year. The range could also exhibit very short-term spikes to outside of this range i.e. to $70 and as low as $30, though I would expect downward price spikes to be far more probable than upward spikes above $64.
Oil Price Crash Implications for the Stock Market
My long-standing view is that as long as GDP is not collapsing, which given US GDP Expectations of 3% for 2015 is not, then a low / falling oil price should be good for the US and much of the global economy and conversely apart form those sectors reliant on a high oil price then this should boost demand in an economy and thus most stock market sectors should benefit from falling energy costs.
The negative impact of falling oil prices is that it could be and actually is a sign of slowing global demand, i.e. it is a sign of a weakening global economy, namely the Euro-zone and China which will impact on US stocks as revenues and profits from foreign markets fall. Complicating this situation further is that as a consequence of the fracking boom, US oil production during the past 5 years has soared by approaching 50% to around 15m barrels per day which now even exceeds Saudi oil production by at least 2 million barrels per day.
Therefore the overall picture is one of substantially increasing supply coupled with slowing demand that will remain a net positive for most US Stocks for 2015, especially those reliant on energy costs such as the airlines and transportation companies, conversely those sectors reliant on high oil prices will suffer such as the oil exploration and drilling and services companies.
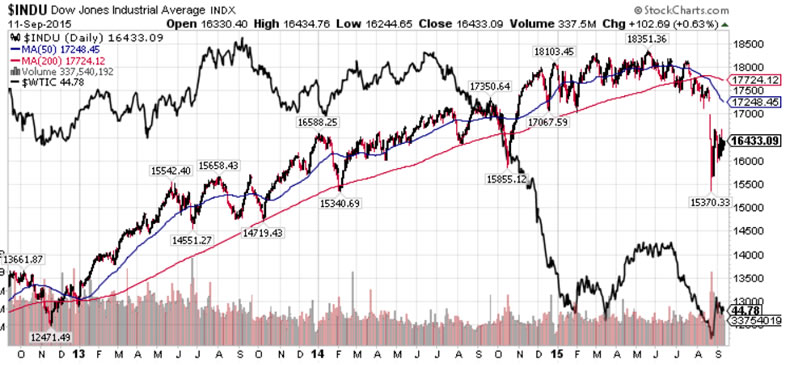
The stock oil price graph further illustrates an overall inverse relationship between oil and general stock prices, that is along as GDP is growing and not contracting (recession). So despite at least some negative blowback from the a weak Euro-zone, slowing China and suffering oil sector. Overall a low oil price should boost the US economy and stock market, so after the market has fully come to terms with the ongoing collapse in oil price then the stock market should resolve to a bullish trend.
U.S. DOLLAR AND THE STOCK MARKET
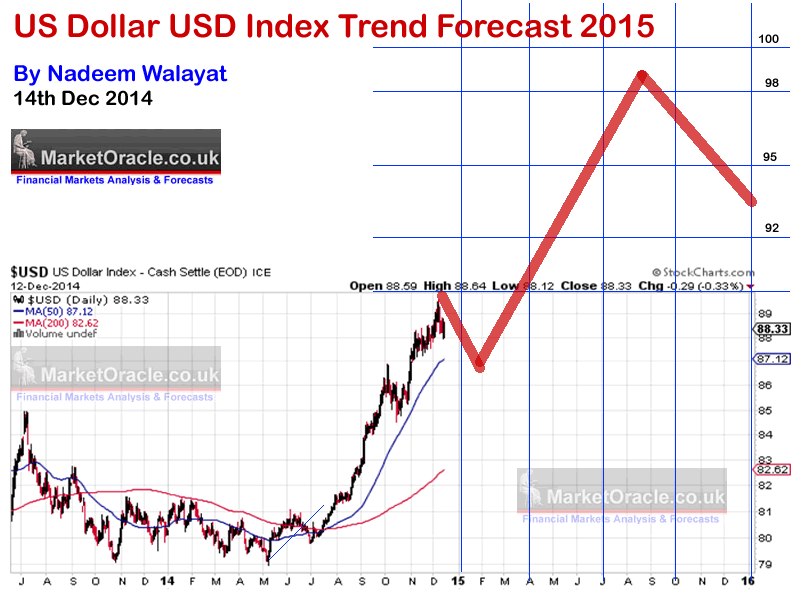
My in-depth US Dollar analysis of Mid December 2014 concluded in the following trend forecast for 2015 to converge towards a peak in the US Dollar by August 2015 of a spike above USD100 before retreating towards 92 by the end of 2015.
14 Dec 2014 - U.S. Dollar Collapse? USD Index Trend Forecast 2015
USD Trend Forecast 2015 Conclusion
My USD Trend forecast conclusion for 2015 is that after the current correction is over by around USD85, that the USD then trends higher towards a target of 98 by mid summer 2014, probably terminating in a spike to just above 100 before correcting back towards 92 by the end of the year as illustrated by the following trend forecast graph.
Implications for the Stock Market
Fundamentally a strong US Dollar tends to be negative for international stocks because it reduces revenues in foreign currency and makes US exports more expensive, conversely it boosts domestic consumer stocks as the costs of imports falls as the same dollar can buy more foreign goods and services i.e. as we have seen with the fall in the crude oil price.
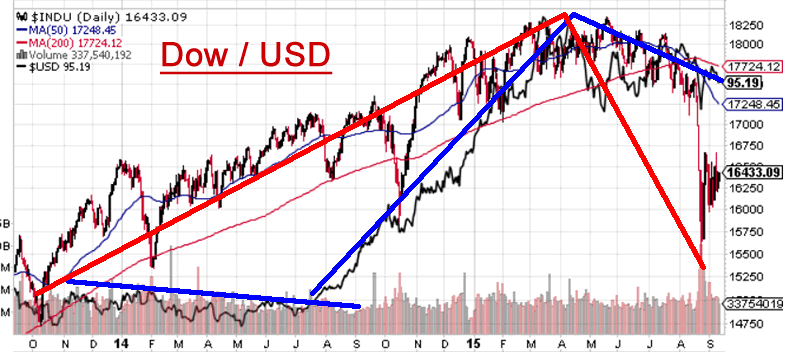
The Dow / USD chart illustrates that a strong US Dollar does tend to act as a damper on stock market trend where a persistent trend for a rising US Dollar acts to slowly erode bullish sentiment over time. So the impact is gradual rather than immediate which means that there can be a delay in stock market reaction to US dollar trend of several months which can end up confusing many analysts who fail to realise that there is a lag.
As my long standing forecast is for US Dollar weakness from August into the end of the year, a trend that is coming to pass, then this should be supportive of the stock market. However, it could take a couple of months for such positive influence to become manifest as the stock market travels through the usually negative months of September and October, but thereafter I would expect the stock market to react strongly to continuing dollar weakness during November and December that could prove to be strong months for stocks.
STOCK MARKET QE AND INTEREST RATES
From QE1, to QE2 to QE3, the Fed since before this stocks bull market began has been printing money and buying mostly government bonds from their fellow bankster brethren the successful result of which has been to suppress interest rates and generate artificial profits for the banks to continue to bank as bonuses for fictitious performance levels. Where the stock market is concerned is that the flood of over $4 trillion of money printing has played a large part in driving the stocks bull market, much as I voiced right at the start of this bull market in March 2009(15 Mar 2009 - Stealth Bull Market Follows Stocks Bear Market Bottom at Dow 6,470 ).
For the whole of 2015 there has been building expectations for the Fed to raise interest rates that had focused on September being the month. However, now that September is actually here, the question to be asked is will the Fed finally pull that trigger or will they err on the side of caution and delay for another month or so ?
In my opinion, whether the Fed raise rates or not this month does not really matter too much at this stage because it will be just a token move of raising rates from 0.25% to 0.50% rather than signaling a series of monthly rate hikes.
So whilst a rate hike would galvanise the bears to herald another stock market collapse as being imminent, the probable reality will be that when the dust settles the stock market will probably be trading several percentages higher a month after the first rate hike. Which means any dip in stocks following the first rate hike is likely to be temporary and nowhere near on the scale of the recent decline.
In fact stocks and housing are more likely to rise during a rate hiking cycle and fall during a cutting cycle which is the exact opposite of the consensus view! Which is common sense because interest rates are cut in times of economic weakness, recession, financial panics, whilst interest rates are raised to cool an over heating booming economy or in response to an Inflation panic, neither of which is taking place today with US CPI inflation of just 0.2% and GDP growth expectations of just 2.5%. So in economic terms, the case for significantly raising interest rates is just not there.
So despite a marginally better than 50/50 probability for a September rate hike, the overall interest rate outlook remains benign for stocks, that is until we either see either inflation soaring above the Feds 2% target or GDP racing towards 4%.
U.S. Bonds
The US Treasury bond bull market appears to have come to a shuddering halt in April of thus year, following which it has drifted lower where even the severe stocks correction flight to quality has failed to lift the bond market towards its highs.
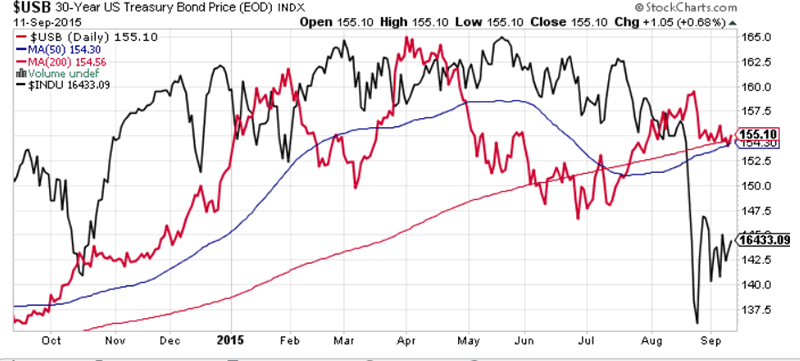
The bond market price action confirms expectations for a rising trend in interest rates which therefore implies erosion of bond prices, which I am sure the Fed wants to happen in an orderly manner rather than panic selling, hence again confirming expectations for a very gradual process for raising interest rates so as not to spook bond holders into a panic rush to the exit.
Where stocks are concerned, the early years of a rate hiking cycle tend to be BULLISH for stock prices, for the interest rate rises tend to take place in a climate of economic strength NOT weakness. Instead it is interest rate CUTS that bulls usually need to fear for they signal weakness ahead as was the case during 2008 and into mid 2009.
Furthermore remember that Fed is just one central bank, yes the most powerful but one, and in this respect what is termed as 'currency wars' best describes the global money printing battle which basically means those nations that do not print money will eventually be forced to print money else see there currency soar against the rampant money printers. We have seen this play out with the European Central Bank which has been forced to start printing money and most recently the Chinese central bank has thrown over $400 billion at its stock market.
Therefore contrary to the growing bearish consensus, I see the announcement for the 'end of QE' as a red herring, as I don't think it will have either a bullish or bearish effect on the bull markets primary trend as in my opinion QE has not really ended, as I am sure it will continue in other forms and perhaps even more extreme manifestations of such as illustrated by Britain's New Labour party leader, Jeremy Corbyn who has proposed the 'Peoples QE', getting the Bank of England to print approx £120 billion per year to directly finance government expenditure. If this is not highly inflationary for PRICING of goods, services and assets then what is?
For directly printing money for consumption is the next natural step of existing quantitative easing programmes most of which are geared towards monetizing government debt, it's just that Quantitative Printing (QP) bypasses the issuance of debt stage altogether. However, the consequences of which has to ultimately end in hyperinflation, just as Weimar Germany found out when it embarked on such a policy during the 1920's when it had to keep doubling the amount of money printed every week in an attempt to keep pace with a fast depreciating currency.
CORPORATE EARNINGS
Whilst the quarterly earnings reports for the Dow Industrials have in significant number been coming in weaker than expected, a collective -2% against the forecast for 2015, nevertheless the consensus earnings growth expected for 2015 is still a healthy 8% and 9% for 2016. Whilst forecast P/E for 2015 is 15 (S&P 20), falling to 13.5 for 2016, so the Dow is NOT trading at a bubble extreme. Which unless an economic crash is on the horizon is not signaling an imminent bear market. However the fact that the earnings forecasts are contracting by approx 2% per quarter means that the earnings growth outlook could continue to erode over the coming quarters which would thus put a dampener on stock prices. So whilst not signaling an imminent bear market nor are they signaling a surging bull market trend, not until we see earning surprises to the upside.
Another important valuation measure is the dividend yield in which respect the DJIA is offering a div yield of 2.61% against 2.24% a year ago (S&P 2.2% / 1.9%). A rising yield is supportive of stock prices.
MOVING AVERAGES - Dow Death Cross
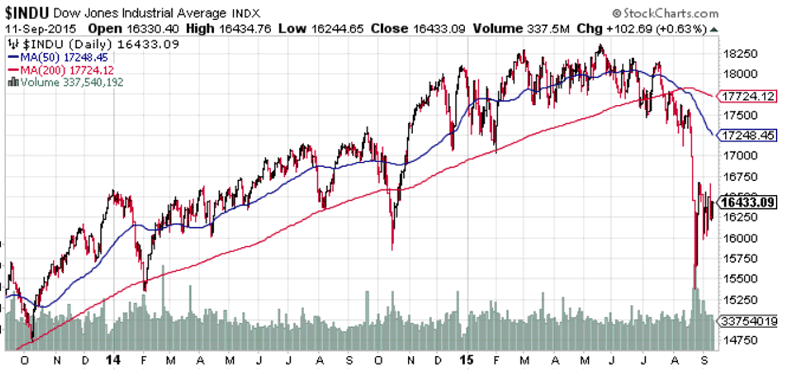
Not only has the Dow broken below its 200 day moving average but that the 200 day and 50 day have crossed (death cross) which is a major bearish signal. At best this suggests that the Dow is going to find it very difficult to make a new all time high this year. In fact the Dow may find it difficult to sustain a rally above 17,000 especially as the 200 day average will act as resistance. On the other hand the worst case scenario is that the 'death cross' has heralded an end to the stocks bull market! However, on a positive note, the death cross's are not very reliable i.e. less than 40% probability of success, so ironically can prove to be a good contrary indicator.
ELLIOTT WAVES
My original EW expectations for 2015 were for a rally into Summer 2015 to be followed by a significant ABC correction as excerpted below:
03 Feb 2015 - Dow Stock Market Trend Forecast 2015 by Nadeem Walayat
Where EWT is concerned I like to keep things simple, none of this double zig zag nonsense and its like but a simple 5 or 7 wave impulse advance followed by an ABC correction.
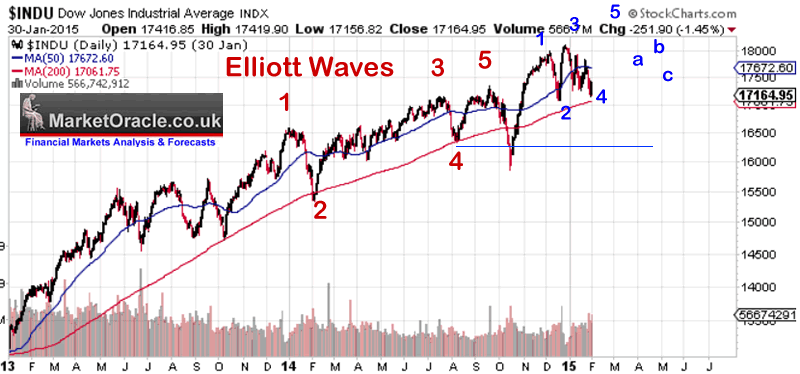
The Dow resolves to a bullish Elliott Wave pattern i.e. implies that the Dow should now embark on a trend to a new all time high, probably before the end of March! So contrary to much of the building picture so far. Thereafter suggests a summer ABC correction back down to around 17,500 to coincide with "Sell in May and Go Away".
The updated chart shows the wave pattern as it unfolded during the year, including the recent C wave spike low that should mark the end of the correction and thus herald an impulse trend higher where the wave count could number as many as 9 waves by Mid 2016 i.e. Elliott Wave implies that the stock market is about to enter a strong bull run that could easily last another 7-9 months and therefore a series of NEW All Time Highs are likely.

DOW CHANNELS
The Dow's three upper channels have managed to contain most of the Dow's price action for the past 3 years, where the Dow repeatedly targets highs at the top of channel 1 and correction lows at channel 2 and 3 that is until this years summer correction broke the trend channel pattern.
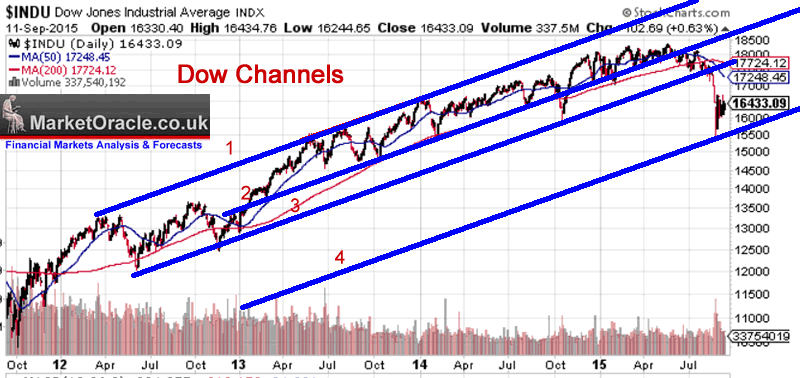
As of writing a new channel from the recent low is expected to contain the price action for it fails then it would confirm that an already weakened stocks bull market is showing serious signs of ending. Therefore for the bull market to continue the Dow should NOT revisit the recent low and any expected weakness over the next few weeks be supported by the rising trend channel. Whilst any rally can be expected to be weak and not make it back to Channel 3 for at least the remainder of thus year which implies a price cap of around Dow 18k.
TREND ANALYSIS
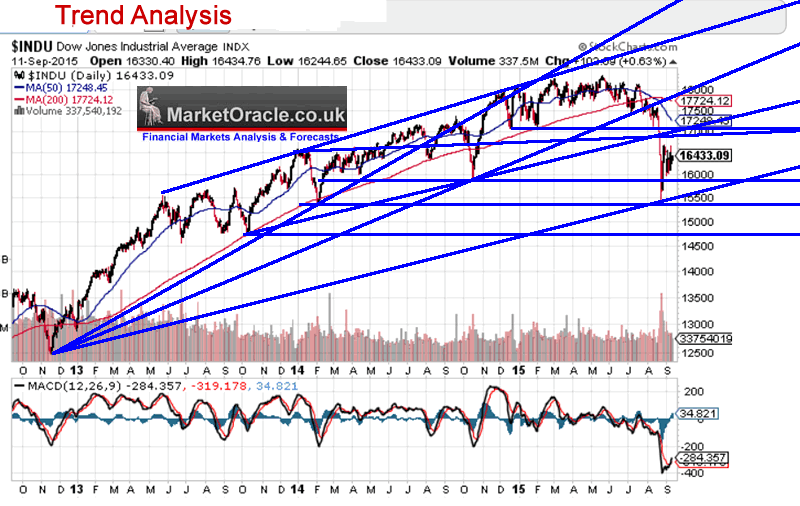
The dow has sliced through a series of trend lines and support levels that have damaged the bull cause. Having bounced off support at 15,350, which was a relatively minor previous low, means the Dow could revisit that low and even break it to target firmer support at 14,700. So in terms of trend analysis the Dow is not looking very healthy with plenty of overhead resistance and weak underlying support that could result in another leg lower towards 14,700.
At best the Dow could spend some time, perhaps as long as a couple of months between 15,400 and 17,000 as the Dow tries to improve the technical picture, in advance of the next leg higher.
PRICE TARGETS - Upside price targets are 17,000, 17,250, 18,100 and lastly 18,350. Clearly if the Dow can overcome 17,250 then that would act to propel the Dow significantly higher to above 18,000 and in touching distance of making a new high. However the probability for such an outcome this year is low.
Whilst on the downside there is weak support at 16,000 and then the recent low of 15,370, a break of which could result in a swift drop to 14,700.
MACD - The MACD is clearly heavily oversold, thus supportive of the stock market going forward. The fact that the Dow has not risen much despite this is worrying and suggests the Dow is NOT done on the downside i.e. we could see a lower low on the Dow before the bottom is in.
VOLATILITY - VIX
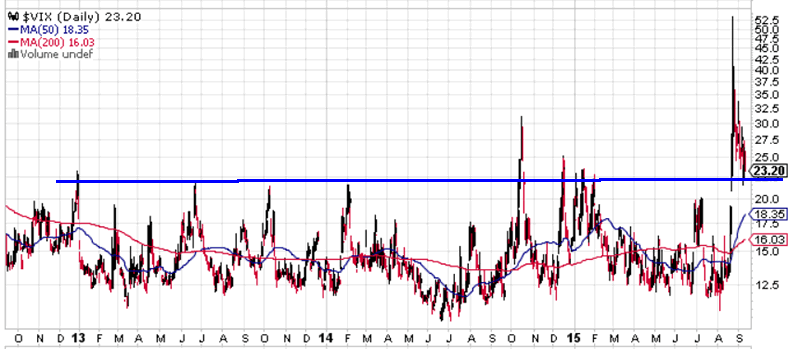
The VIX chart illustrates the strength of the current stock market correction that far surpasses anything of the past 3 years! So it is not surprising that it has generated so much bearish commentary. However the VIX chart also shows that volatility has already fallen by more than 50% from its recent peak which is bullish for the stocks going forward as the volatile correction has done a good job of dissipating the building bullish consensus to bring the market towards a 50/50 knife edge which is what one wants for sustained bull runs.
Therefore VIX is supportive of the view that the stock market is setting itself up for a major bullish rally not only into the end of 2015 but well into 2016! The VIX is also signaling to expect a more volatile trend going forward i.e. wider swings and more severe intra-day spikes.
Formulating a Stock Market Forecast
In the immediate future the stock market is facing two downward pressures from a weak chinese stock market and prospects for a September Fed rate hike, which even if does not happen then speculation will immediately turn to Octobers meeting, which therefore implies an September rate hike would be better for the stock market so as to get it out of the way. Therefore the rest of September and into Mid October looks weak where as trend analysis indicates that the Dow could break its recent low of 15,370 before putting in a bottom at maximum stock market bearishness.
Key questions to answer
1. - 17,823 - Will the Dow Close Up for its Seventh Year in a Row?
The latest close of 16,433 puts the Dow 1400 points / 8.5% from closing up on the year. Which given that the Dow is likely to see further weakness before it bottoms then it may only have just over 2 months to rally by some 10%, which would be a tough call. On the plus side, heavy overhead resistance lies above 18,000 so to achieve a gain for the year the Dow does not need to bust through overhead resistance.
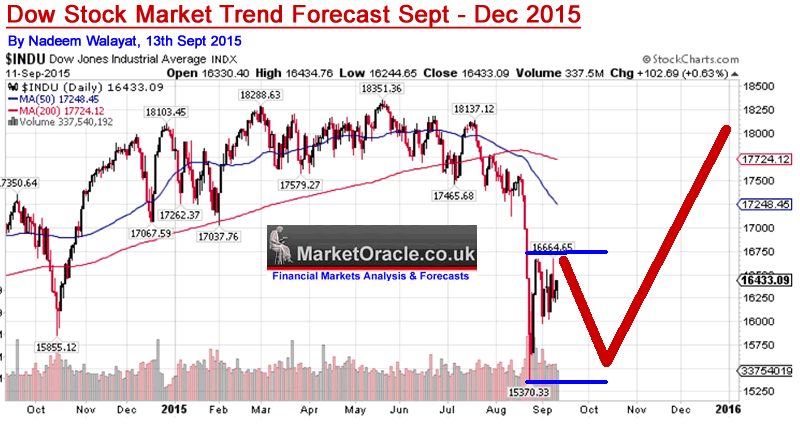
Therefore I do still expect the Dow to recover from current weakness to end UP on the year for the SEVENTH YEAR! Which means I expect the Dow to close above 17,823.
2. Trend Trajectory?
The next month or so is likely to see continuing weakness, that translates into a trading range that targets revisiting and probably even breaking the recent low of 15,370. Following which we could see a phenomenal turnaround in the Dow that will catch many market analysts by surprise just as participants are at their most bearish at the market bottoms, following which the Dow could swiftly add as many as 2,500 points / 16% in just 2 months by the end of this year.
Dow Stock Market Forecast 2015 Conclusion
My final conclusion is for continuing weakness that will result in a volatile trading range with a probable re-test of the recent low of 15,370 by Mid October that will set the scene for a strong rally into the end of the year that could see the Dow trade above 18,000 before targeting a gain for a seventh year in a row at above 17,823 as illustrated below:
Ensure you are subscribed to my always free newsletter for ongoing in-depth analysis and concluding detailed trend forecasts that include the following planned newsletters -
- US Dollar Trend Forecast Update 2015
- Islam 3.0
 Also subscribe to our Youtube channel for notification of video releases and for our new series on the 'The Illusion of Democracy and Freedom', that seeks to answer questions such as 'Did God Create the Universe?' and how to 'Attain Freedom' as well as a stream of mega long term 'Future Trend Forecasts'.
Source and Comments: http://www.marketoracle.co.uk/Article52257.html
By Nadeem Walayat
Copyright © 2005-2015 Marketoracle.co.uk (Market Oracle Ltd). All rights reserved.
Nadeem Walayat has over 25 years experience of trading derivatives, portfolio management and analysing the financial markets, including one of few who both anticipated and Beat the 1987 Crash. Nadeem's forward looking analysis focuses on UK inflation, economy, interest rates and housing market. He is the author of five ebook's in the The Inflation Mega-Trend and Stocks Stealth Bull Market series that can be downloaded for Free.
 Nadeem is the Editor of The Market Oracle, a FREE Daily Financial Markets Analysis & Forecasting online publication that presents in-depth analysis from over 1000 experienced analysts on a range of views of the probable direction of the financial markets, thus enabling our readers to arrive at an informed opinion on future market direction. http://www.marketoracle.co.uk
Disclaimer: The above is a matter of opinion provided for general information purposes only and is not intended as investment advice. Information and analysis above are derived from sources and utilising methods believed to be reliable, but we cannot accept responsibility for any trading losses you may incur as a result of this analysis. Individuals should consult with their personal financial advisors before engaging in any trading activities.
Nadeem Walayat Archive |
© 2005-2022 http://www.MarketOracle.co.uk - The Market Oracle is a FREE Daily Financial Markets Analysis & Forecasting online publication.


