


Halloween Came Early this Year on Wall Street
Stock-Markets / Stock Markets 2015 Sep 18, 2015 - 12:34 PM GMTBy: Clif_Droke

 The Federal Reserve guessing game ended Thursday after the FOMC made its decision on interest rate policy. The Fed left rates unchanged in a tip of the hat to investors who felt the economy was vulnerable to overseas weakness. This was what most on Wall Street wanted, although there was a sharp intraday reversal after the announcement (apparently a case of buy the rumor, sell the news).
In last week's commentary I emphasized that there was a built-in Wall of Worry for stocks to climb based on the recent spike in bearish investor sentiment. There's still a lot of short interest in the market which could be used to fuel a short covering rally, especially now that Fed interest rates are unchanged. There's no denying that equities love low interest rates, and the longer the Fed leaves the benchmark rate unchanged the better it bodes for investors. Whether or not it actually helps the economy is a different story, however.
There seems to be some contention among pundits as to whether the Fed should raise interest rates before the year is over. The hawks maintain that keeping rates near zero would only encourage another equity market bubble and eventually lead to another credit crisis down the road. The doves insist that the longer the Fed funds rate remains at or near zero, the more stimulative it will prove for the financial market and the banking system. My view is that bubbles occur when the Fed funds interest rate fails to keep pace with Treasury yields. Considering that government bond yields aren't much higher now than they were at the depths of the 2008 credit crash, I see no problem with keeping the Fed funds rate low for a while longer. At the end of the day, though, it's up to investors to decide whether or not they like the Fed's policy.
Assuming the market is ready to kick off a recovery rally, there are a couple of areas in need of improvement. I'd like to see some continued improvement in the market's internal condition first and foremost. The minimum requirement for internal repair is a diminution of the NYSE new 52-week lows. On a positive note, the number of stocks making new lows has diminished each day since Sept. 11. Moreover, we finally saw the first day since Sept. 3 in which there were fewer than 40 new lows on Thursday, Sept. 17. If the new 52-week lows remain below 40 for the next few sessions it will confirm that the market has returned to a normal, healthier internal state.
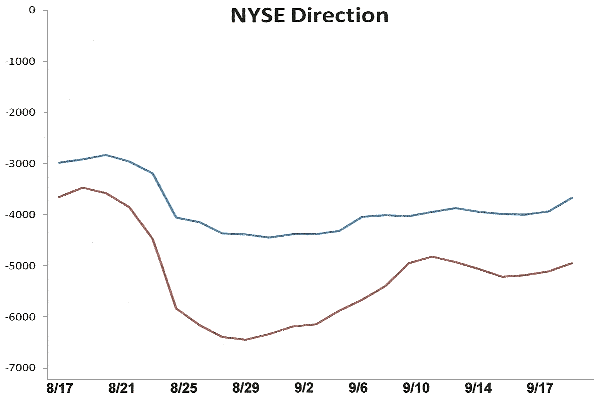
The NYSE Hi-Lo Momentum indicator series known as HILMO is based on the new 52-week highs and lows and shows the stock market's path of least resistance on a short-, intermediate-, and longer-term basis. The short-term directional components for HILMO are looking better than they have in a long while but still need more improvement. You can see here that they're trying to turn up in sustained fashion, though. If it continues from here it will support the bulls' attempts at rallying the major indices back to the pre-panic levels from early August.
Meanwhile, the intermediate-term HILMO components are in even greater need of reversal. Note the continued downward trend reflected in the sub-dominant interim (blue line) and dominant interim (red line) indicators shown below.
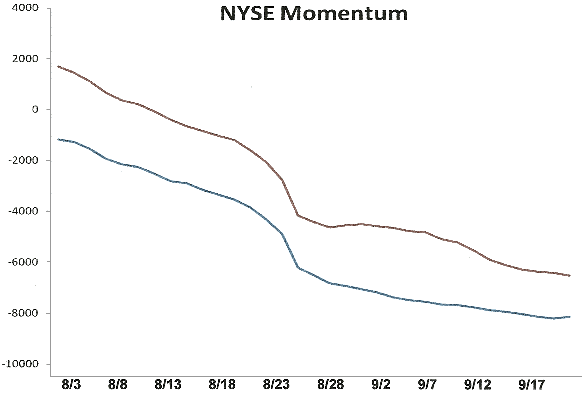
The decline in the intermediate-term HILMO components shown above is consistent with the fact that our intermediate-term trend indicator is still technically bearish. To get a renewed intermediate-term buy signal we need to see a majority of the six major indices back above their 30-day and 60-day moving averages on a weekly closing basis.
Our immediate-term (1-3 week) trend indicator has confirmed a bottom, however. All six of the major indices - the Dow, SPX, NDX, NYA, MID and RUT - have all closed at least two days higher above their 15-day moving averages to confirm the bottom. This technically paves the way for a relief rally. It's worth mentioning that panic declines are usually reversed within a couple of months once the fear that catalyzed the sell-off has completely dissipated.
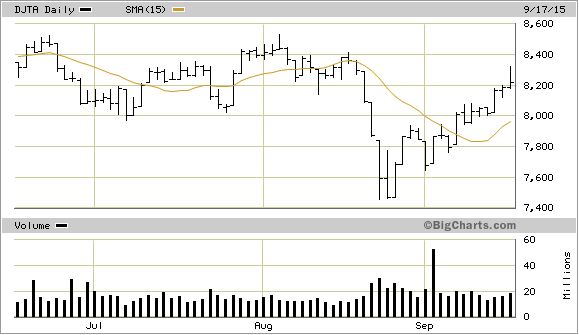
It's also worth mentioning that the Dow Jones Transportation Average (DJTA) has erased most of its losses which it sustained during the "flash crash." This has positive implications for the Dow Industrials, shown above. Keep in mind that the DJTA led the way lower for the Industrials heading into August. It's constructive, from a Dow Theory perspective, that the Transports are showing relative strength at this time.
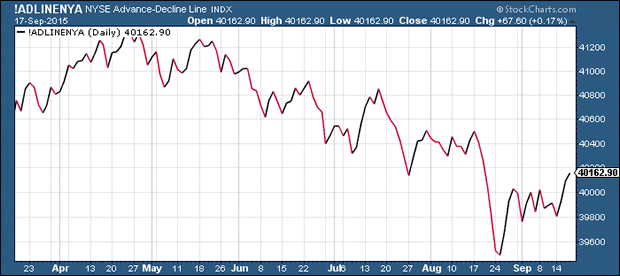
The NYSE Composite Index (NYA), which I consider to be the most comprehensive measure of the U.S. stock market, has barely budged higher recently and hasn't yet broke out of its 3-week consolidation pattern. By contrast, the NYSE advance-decline (A-D) line is finally starting to show relative strength. One of the things I like to see at a market bottom is for the A-D line to show leadership versus the NYA. This has started to happen, and if it continues should bode well for the prospects of the NYSE Composite Index.
Mastering Moving Averages
The moving average is one of the most versatile of all trading tools and should be a part of every investor's arsenal. Far more than a simple trend line, it's also a dynamic momentum indicator as well as a means of identifying support and resistance across variable time frames. It can also be used in place of an overbought/oversold oscillator when used in relationship to the price of the stock or ETF you're trading in.
In my latest book, Mastering Moving Averages, I remove the mystique behind stock and ETF trading and reveal a simple and reliable system that allows retail traders to profit from both up and down moves in the market. The trading techniques discussed in the book have been carefully calibrated to match today's fast-moving and sometimes volatile market environment. If you're interested in moving average trading techniques, you'll want to read this book.
Order today and receive an autographed copy along with a copy of the book, The Best Strategies for Momentum Traders. Your order also includes a FREE 1-month trial subscription to the Momentum Strategies Report newsletter: http://www.clifdroke.com/books/masteringma.html
By Clif Droke
www.clifdroke.com
Clif Droke is the editor of the daily Gold & Silver Stock Report. Published daily since 2002, the report provides forecasts and analysis of the leading gold, silver, uranium and energy stocks from a short-term technical standpoint. He is also the author of numerous books, including 'How to Read Chart Patterns for Greater Profits.' For more information visit www.clifdroke.com
Clif Droke Archive |
© 2005-2022 http://www.MarketOracle.co.uk - The Market Oracle is a FREE Daily Financial Markets Analysis & Forecasting online publication.