


Stock Market Intermediate Downtrend (Phase II)
Stock-Markets / Stock Markets 2015 Sep 21, 2015 - 08:56 AM GMTBy: Andre_Gratian

 Current Position of the Market
SPX: Long-term trend - Bull Market?
Intermediate trend - SPX is in the midst of an intermediate correction (at least).
Analysis of the short-term trend is done on a daily basis with the help of hourly charts. It is an important adjunct to the analysis of daily and weekly charts which discusses the course of longer market trends.
INTERMEDIATE DOWNTREND
(PHASE II)
Market Overview
Last week, the SPX gave a strong indication that it had completed the counter-trend rally which started from 1865 on 8/24. As suspected, it waited until the FED had announced its decision to race up to (and slightly beyond) my P&F target of 2010/2013 in a spectacular short-term climax which retraced even faster than it went up, closing down 30 points from the high. The decline continued on Friday with another loss of 32 points, essentially meeting a 1953 projection with a low of 1953.45 and bouncing to 1958 at the close.
Since the index appeared to have completed 5 down waves as well as having met a near-term projection, the odds are that this completes the first down wave of phase II or "C" ("A would be the 1865 low, and "B" the 2020 top), and that we are ready for a bounce up within that second phase. A 50% retracement of the decline to about 1986 sounds reasonable before continuing with the "C" wave.
I had mentioned previously that this pattern could very well be part of a measured move. Nothing in the action of the last couple of days has altered that view. If it turns out to be correct, and if it is a full 100% of the first phase, this move should end around 1780.
Intermediate Indicators Survey
The weekly histogram has somewhat steadied, but the MACD is still declining and making new lows. The weekly SRSI, at 19.74 is still negative. It would have to rise above 50 to suggest that an uptrend is taking hold. The weekly NYAD has firmed up a little but has the look of a consolidation in a downtrend.
The McClellan Summation Index (courtesy of StockCharts.com) has rallied from its low, standing at -378.60, and is still in a downtrend with no sign of divergence. It is posted under the weekly chart for better comparison with price.
The 3X P&F chart gave us a count for the rally which was met almost exactly. We'll have to wait for another counter-trend rally to exhaust itself before we can confirm the downside potential.
Chart Analysis
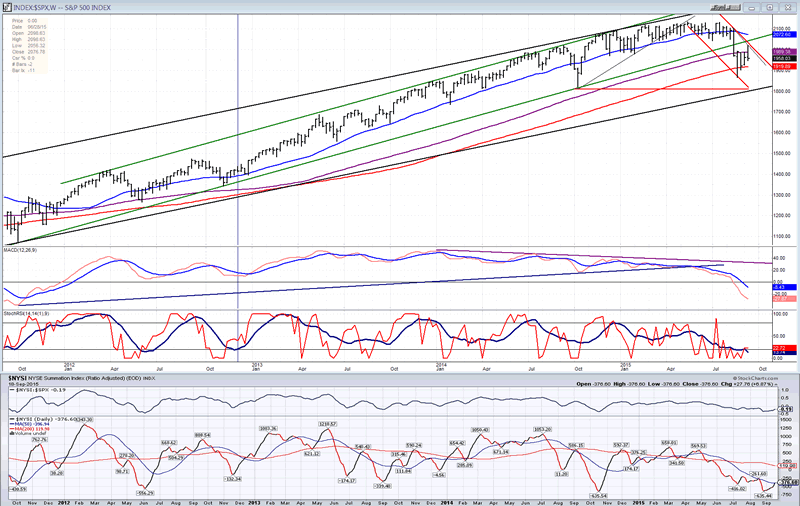
Now that we are seemingly in an intermediate downtrend, we should analyze the Weekly SPX chart (courtesy of QCharts.com, as well as others below) in order to get a larger perspective. The green channel, which represents the uptrend from the October 2011 low has been penetrated to the downside, but not the longer term (black) channel from the 2009 low. However, the DJIA, which is not influenced by high flying stocks has violated its long term channel. That does not mean that the bull market has ended. To come to that conclusion, much more weakness will have to occur. For now, because of the duration of the pull-back and the prospect that there will be more immediately (and into early October) we know that this is more than a short term correction but, so far, it does not rank very high in length as one of intermediate nature.
We can turn to structural analysis to help determine where we are. There are two possibilities: the first is that we are in a primary wave IV, with wave V to come after it is complete; the second is that the entire uptrend was only a long QE corrective move which has ended and put an end to the bull market, as well. We can express a personal opinion about which it is, but only the market can tell us, eventually, the correct interpretation.
It is clear on this chart that the upside price action of the past few weeks has not turned around the budding downtrend. The descending channel from the high was not violated. The index did find support on the 120-wk MA, but could not rally past the 90-wk. Will it be able to close below the 120 on the second try? There is a good chance that it can, but time may be too short to go much below the bull market channel line.
As for the oscillators, the MACD just barely narrowed its distance between the two MAs and the SRSI remains in oversold territory. No sign of a turn there.
The NYSI, although an oscillator, bears the same negative resemblance to the weekly A/D (cumulative) line.
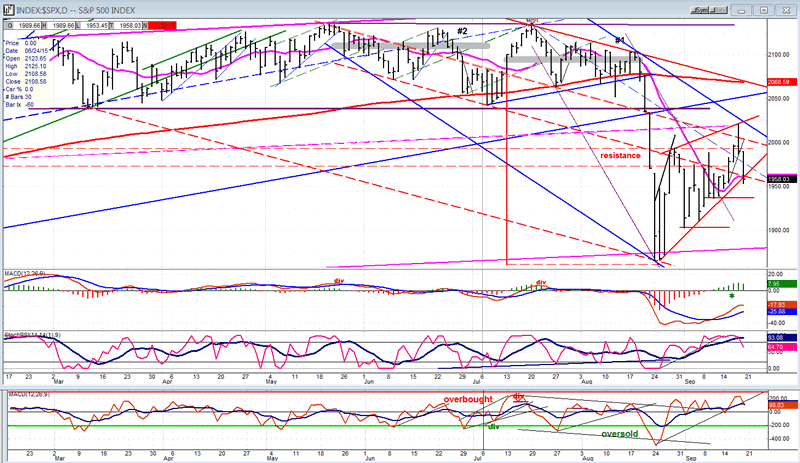
On the following chart of the Daily SPX, the blue channel actually matches the red one on the weekly chart. We can see better here, that in spite of a strong counter-trend rally, the index failed to reach the top channel line. The corrective pattern did change from a potential symmetrical triangle to a wedge whose bottom line was slightly violated, but the short term oversold state of the market will probably not be able to punch through what is a good support level. It would also appear that we may have completed a 5-wave down phase which met the 1953 short term target.
If the view that this completed a 5-wave move is valid, and if any bounce from here represents a wave 2, even greater weakness should be seen after it completes as wave 3 comes into play. Cycles are favorable for that scenario and, according to the Trader's Almanac, historically, September is the second worst month for stocks, and the second half of the month is usually very weak. The technical position of the SPX appears to agree that this is what lies ahead of us.
A rising wedge normally retraces all the way down to its beginning, at a minimum. If we have a measured move, the potential is even greater. The oscillators are in a position which indicates that the beginning of a decline has started.
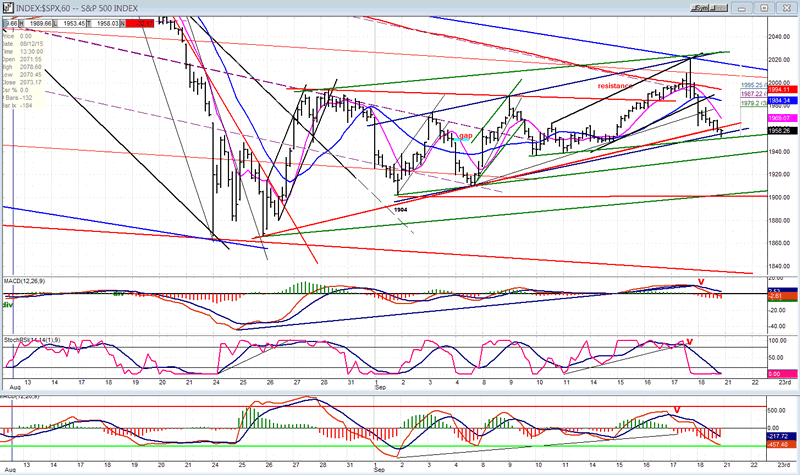
On the Hourly chart, the blue lines also delineate the short term downtrend. The green lines are pre-set and fixed, in the sense that they are all parallel to one another and drawn from a former high or a former low. I have discussed them before when the index was still trading in its topping formation.
You can judge their effectiveness for yourself. The top one helped to stop the rally, and the lower one, the decline; but they both had some help. At the top, the black trend line across two former tops was a factor, as was its parallel drawn at the 9/4 low. At the top, the index also encountered the declining blue channel line and, at the bottom, the red bottom line of the wedge.
Here, the 5-wave pattern of the decline is easier to see, including the deceleration shown in the 5th wave which, ostensibly, bottomed on Friday about 15m before the close. If the proposed structure is correct, we should expect a 3-wave move for wave 2.
The oscillators are in a position to turn up for a relief rally which should define wave 2. I have shown where the various levels of retracement lie. I think it would be safe to choose the .50 level (1987), since I have a P&F projection which closely matches it.
As always, if we deviate too much from the given scenario, we will have to re-examine the larger structure.
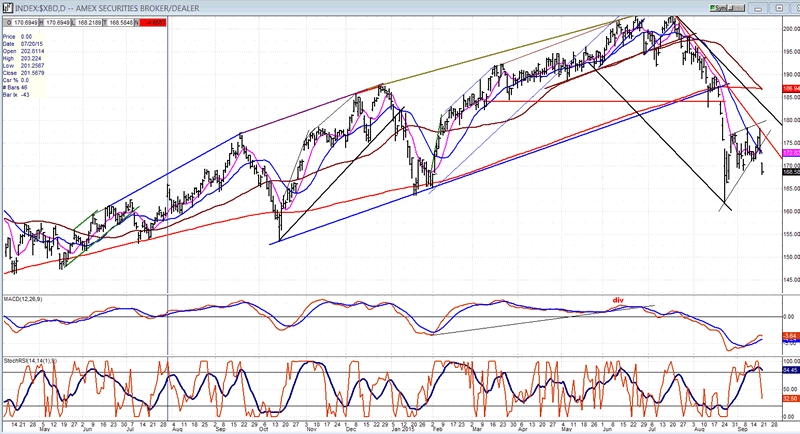
XBD (Amex Securities Broker/Dealer)
XBD appears to be confirming the above analysis. It did not surpass its former short-term high as the SPX did, and it dropped below its early September low, while SPX has not. Thus, it seems to be fulfilling its function as a market leader by pointing out the direction of the next move.
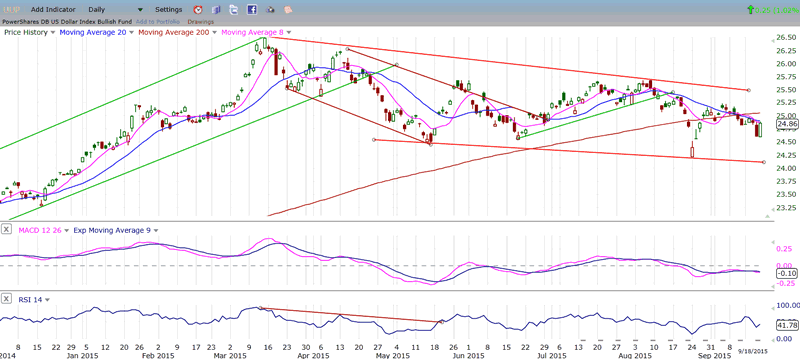
UUP (dollar ETF)
UUP pulled back after its presumed attempt at ending its consolidation with a new uptrend, but on Friday, it looked as if it was ready to continue its up-move. It made a candle which missed being bullish engulfing by one penny! It only equaled the former day's high and did not surpass it. We'll see if this was close enough to get something going on the upside.
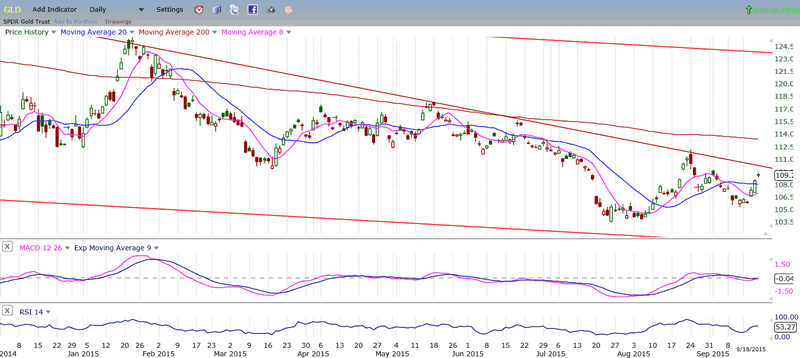
GLD (Gold trust)
GLD took advantage of the near term correction in UUP to push a little higher. Of course, if UUP moves up from here, it should retrace once again; but the chances of its retracing all the way down to 100 are quickly diminishing. It may be content to re-test its former low or come close to it. My guess is that after one more pull-back, it will be ready for a break-out move beyond its declining trend line.
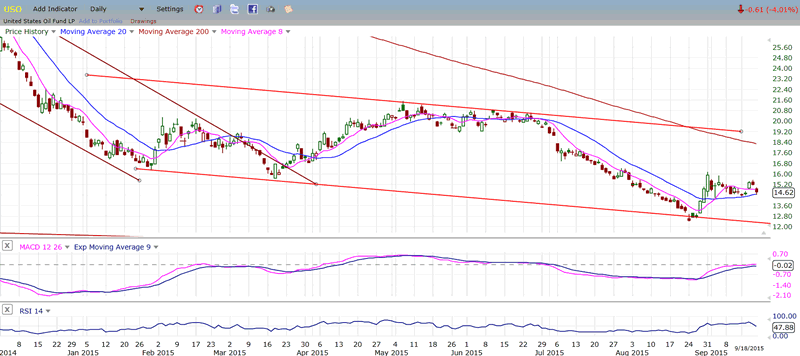
USO (US Oil Fund)
USO also tried to move up, but failed short of its previous short-term top. I suspect that it may need to create a base before being able to move much higher.
Summary
SPX looks as if it made a classic counter-trend rally top on Thursday and confirmed the reversal with additional weakness on Friday. I still believe that whatever corrective pattern it made, it was the mid-point of a measured move which, if it is completely fulfilled, should take it down to about 1780 before it can end its correction.
Andre
FREE TRIAL SUBSCRIPTION
If precision in market timing for all time framesis something that you find important, you should
Consider taking a trial subscription to my service. It is free, and you will have four weeks to evaluate its worth. It embodies many years of research with the eventual goal of understanding as perfectly as possible how the market functions. I believe that I have achieved this goal.
For a FREE 4-week trial, Send an email to: info@marketurningpoints.com
For further subscription options, payment plans, and for important general information, I encourage
you to visit my website at www.marketurningpoints.com. It contains summaries of my background, my
investment and trading strategies, and my unique method of intra-day communication with
subscribers. I have also started an archive of former newsletters so that you can not only evaluate past performance, but also be aware of the increasing accuracy of forecasts.
Disclaimer - The above comments about the financial markets are based purely on what I consider to be sound technical analysis principles uncompromised by fundamental considerations. They represent my own opinion and are not meant to be construed as trading or investment advice, but are offered as an analytical point of view which might be of interest to those who follow stock market cycles and technical analysis.
Andre Gratian Archive |
© 2005-2022 http://www.MarketOracle.co.uk - The Market Oracle is a FREE Daily Financial Markets Analysis & Forecasting online publication.