Gold Price Rally: The Bottom is In?
Commodities / Gold and Silver 2015 Sep 21, 2015 - 12:42 PM GMTBy: Dan_Norcini
 As mentioned in an earlier post this morning, the TRIPLE THREE safe havens, the Yen, Bonds and Gold, are all getting a boost in today's session with the Bonds being the stand out performer as can be expected.
Gold, while moving higher, is also being weighed down by falling commodity prices with weakness in this sector a reason why many traders are selling into its rally.
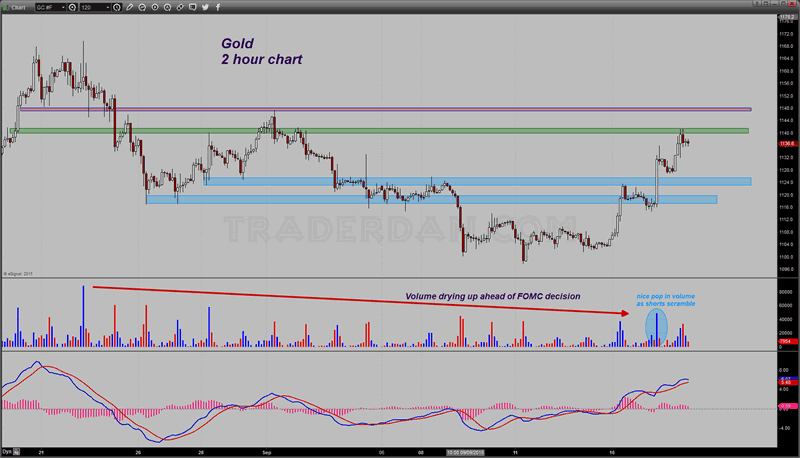
Gold 2-Hour Chart

On the short term chart, the metal has run to a band of overhead resistance near $1142-$1140. That region is attracting a fair amount of selling.
The spike in volume that occurred later in the session YESTERDAY was a surge of short covering by weaker-handed shorts who were blindsided by the extent of dovishness coming out of the FOMC and the Yellen presser.
However, much as is the case with crude oil and the many other commodities, especially copper, that same dovishness is being construed to support fears of slowing economic growth, especially in emerging markets.
We have seen what a deflationary sentiment does to the gold price and it is never pretty. While the Dollar has been derailed by the FOMC dovishness, it is currently seeing some buying coming back in with many traders feeling its downside reaction was overdone.
After all, Draghi and company are not going to stand for a soaring Euro nor are Abe and company going to tolerate a soaring yen. I am looking for Draghi to sound a very dovish tune ahead of the ECB's next policy meeting and I fully expect an effort to talk down the Euro from that quarter.
Meanwhile, gold has had a nice little pop here but unless it can extend through the resistance zone noted, shorts will become emboldened and begin to press it, especially if the Dollar stabilizes.
Once again, the fly in the ointment when it comes to gold, is the lackluster performance of the mining shares. Thus far, the high of the session was made early in the morning. Since then, they have done nothing but fade. Maybe they can reverse ahead of the closing bell and go out on a strong note but I remain extremely skeptical of the sector.
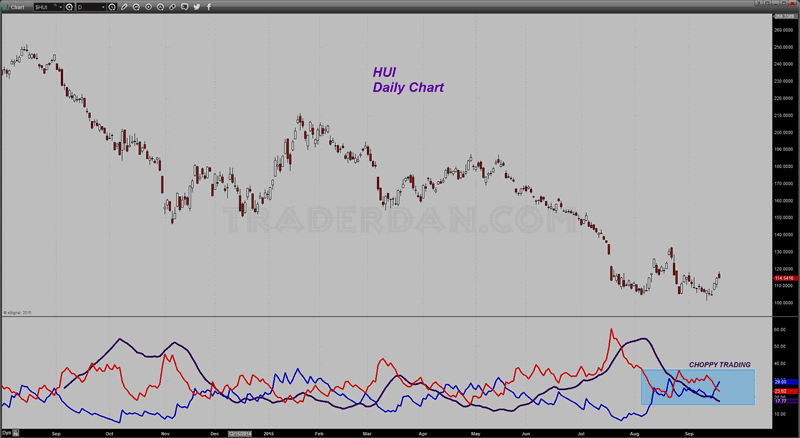
HUI Daily Chart

Just this morning, there was a note by an investment bank RBC that the possibility of a credit rating downgrade could hit Barrick is gold prices linger near the $1100 level.
The price action in the HUI has been decidedly choopy over the last 6 weeks with the index currently moving back and forth in a wide trading range. It is not unexpected that the shares are getting a bit of a bid, after all, we are talking about a sector that has performed so miserably that it has managed to wipe out THIRTEEEN YEARS of price action yet for all that, the lack of buying enthusiasm remains palpable.
I wish to repeat my warning from yesterday - the gold cult is screaming once again about gold shortages at the Comex. Remember, since gold entered its current bear market some years ago when it broke down below $1530 and never regained that level, this crowd has conjured up one wild theory after another to support their reckless and subsequently-proven-to-have-been-false claims that gold was ready to rocket "any day now".
Backwardation, JP Morgan cornering gold on the long side, negative GOFO rates, surging Chinese and/or Indian demand, Bank bail-ins, Russian Ukranian invasions, Chinese stock market worries, Greece exiting the Euro, and on and on and on and on and on... Blah, blah and more blah.
Every single one of these utterly useless and worthless claims have done nothing except leave those who subscribed to them all the more poorer for paying the least bit of heed.
The gold cult has no shame and it also believes the rest of us have no memories. Do not let this group claim you as a victim. Respect the price action on the charts and let that be your guide. Your wallet will thank you in the weeks and years ahead.
if gold ever does manage to somehow become a bull market once more, the chart will show it. Until then, the primary trend in gold remains a bear. That means you sell rallies until the market price action tells you to do otherwise.
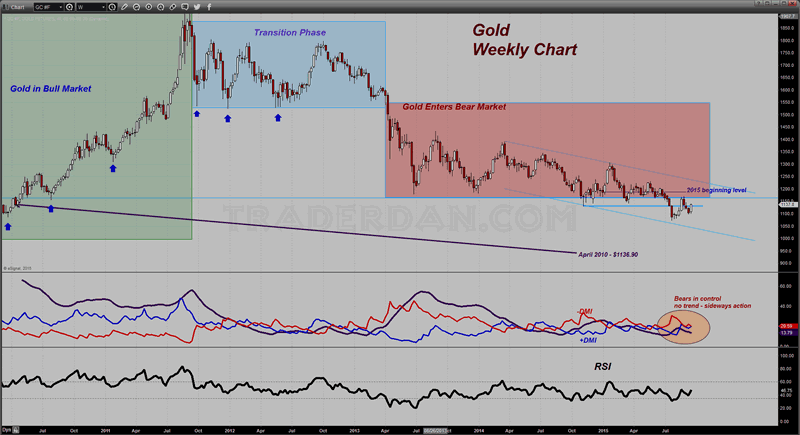
Gold Weekly Chart

Here is a look at the reason - this is the intermediate term or weekly chart. Notice that for all the hoopla being raised by the gold cult about gold shortages at the Comex, the price remains well below its starting level of this year. Not only that, it has barely managed to scratch and claw its way back to broken support, which is the horizontal line drawn off the November 2014 spike low. It also remains BELOW the broken support line just above $1150 which is the bottom of that shaded rectangle that I have drawn in.
What I see when I look at this chart, is a market in the midst of DOWNSLOPING PRICE CHANNEL and thus one that is grinding relentlessly lower.
Now, maybe that will change and the market will finally start a trend higher but it has an awful lot of work to do on the technical price charts before one can say with any objectivity, that the worst is over for gold.
Personally, I do not think the true bottom is in yet. I am keeping an open mind but at the first sign of any possibility of a Fed interest rate hike, gold is headed lower again and it may very well do that even before then, if commodity prices start tumbling any further.
Note how the RSI on the weekly chart cannot even make it to the 60 level. That is how weak this market is. If that level ever does get taken out and the technical posture on this intermediate term chart changes for the better, I will shift with it. Until it does, ignore the gold cult... they will end up ruining you financially.
While they huff and puff and bluster and fluster about this or that as being wildly bullish for gold, remember, remember, remember, how many wild claims they have made for the last 3-4 years and how much lower and lower gold and the shares have gone. Their financial net worth, has been devastated whereas those who objectively stuck with the advice of the price charts only, have managed to prosper. After all, that is what trading/investing is really about - to make money - not to sing songs from the same choir book and console oneself while one's net worth is going up in smoke.
Dan Norcini
Dan Norcini is a professional off-the-floor commodities trader bringing more than 25 years experience in the markets to provide a trader's insight and commentary on the day's price action. His editorial contributions and supporting technical analysis charts cover a broad range of tradable entities including the precious metals and foreign exchange markets as well as the broader commodity world including the grain and livestock markets. He is a frequent contributor to both Reuters and Dow Jones as a market analyst for the livestock sector and can be on occasion be found as a source in the Wall Street Journal's commodities section. Trader Dan has also been a regular contributor in the past at Jim Sinclair's JS Mineset and King News World as well as may other Precious Metals oriented websites.
Copyright © 2015 Dan Norcini - All Rights Reserved
All ideas, opinions, and/or forecasts, expressed or implied herein, are for informational purposes only and should not be construed as a recommendation to invest, trade, and/or speculate in the markets. Any investments, trades, and/or speculations made in light of the ideas, opinions, and/or forecasts, expressed or implied herein, are committed at your own risk, financial or otherwise. The information on this site has been prepared without regard to any particular investor’s investment objectives, financial situation, and needs. Accordingly, investors should not act on any information on this site without obtaining specific advice from their financial advisor. Past performance is no guarantee of future results.
Dan Norcini Archive |
© 2005-2022 http://www.MarketOracle.co.uk - The Market Oracle is a FREE Daily Financial Markets Analysis & Forecasting online publication.


