


Coffee Price Surges
Commodities / Coffee Sep 26, 2015 - 04:59 PM GMTBy: Austin_Galt

 Previous analysis outlined that while price was in a potential bottoming zone, without any signs of price turning back up then further downside must be favoured. That changed today in a big way. Let's see exactly what that is beginning with the daily chart.
Coffee Daily Chart
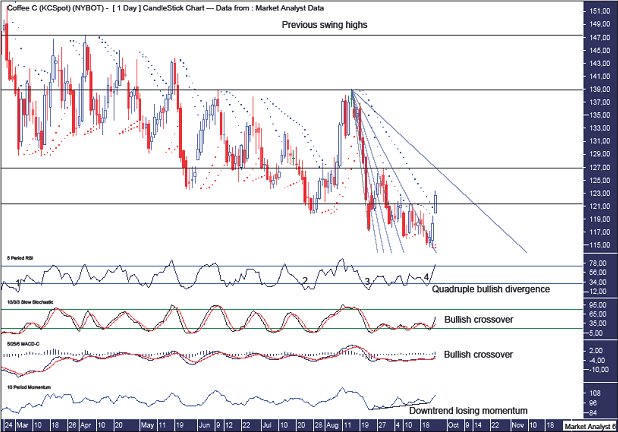
The black horizontal lines represent previous swing high levels. The lowest line denotes the swing high level of $121.40 set on 15th September 2015. Today price broke above that level. This is the first time price has managed to crack above a previous swing high level on this daily chart since the October 2014 high. That is one year of a solid downtrend that ended today. Certainly, you can see on this chart that only goes back to February 2015 that price was never able to rally back above the previous swing high.
Another promising development was price overcoming resistance from the 76.4% Fibonacci Fan angle. We can see price was recently trending down along this angle as it put in a low at $14.55 yesterday. Perhaps the next area of resistance will come from the 88.6% angle.
The candle yesterday which brought in the low was a bullish outside reversal candle. Nice. Price following through to the upside in impulsive fashion today is even nicer!
I have added both a tight and loose PSAR indicator which shows price busting the tight setting resistance yesterday and the loose setting resistance today.
The low set up a quadruple bullish divergence on the RSI.
The Stochastic and MACD indicators have just made a bullish crossover.
The Momentum indicator shows the downtrend has been losing momentum over the last month.
So, we will have a higher high in place shortly and then I will be looking for price to come back down to put in a higher low.
Let's now check out the weekly chart.
Coffee Weekly Chart
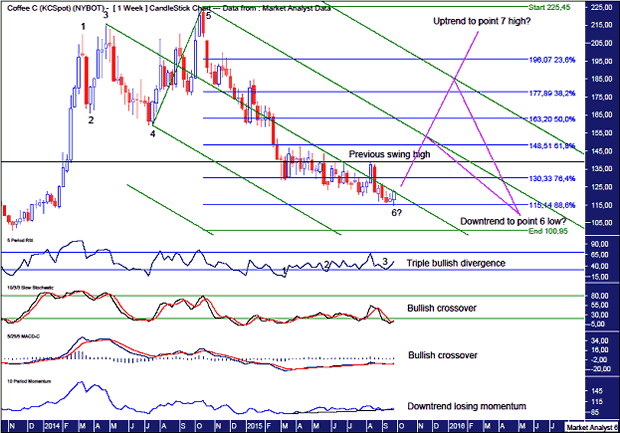
I have added Fibonacci retracement levels of the move up from low to high. Price has marginally clipped the 88.6% level. This was outlined previously as the area for price to make a last stand. Price is now up off the canvas and having a crack.
The weekly candle is a bullish outside reversal candle. Nice.
The RSI shows a triple bullish divergence.
The Stochastic and MACD indicators have just made a bullish crossover thanks to the strong ending to the week.
The Momentum indicator show the downtrend has been losing momentum for many months now.
We are following a 7 point broadening top formation with points 1 to 5 in place. That means we are searching for a point 6 low. Yesterday's low may well be it but I must admit to having my doubts. Sure, price can embark on a significant rally now but it may fail to trade above the point 5 high at $225.45 and subsequently head back down to new lows.
I have drawn an Andrew's Pitchfork with added warning lines. We can see price is against resistance from the middle channel line. I expect price to punch on through shortly but resistance from the upper channel line may be more formidable. If price can overcome that then the upper warning line may represent a challenge. Overcoming that would likely see price head to new highs in search of a point 7 high. We will just have to monitor the price action and look for signs of turning back down.
Which scenario do I favour?
Personally, I favour a bear rally up to the warning line before price reverses and heads to new lows. But that is just my opinion which could easily change depending on how price behaves.
For now, the bulls are running on coffee fumes!
By Austin Galt
Austin Galt is The Voodoo Analyst. I have studied charts for over 20 years and am currently a private trader. Several years ago I worked as a licensed advisor with a well known Australian stock broker. While there was an abundance of fundamental analysts, there seemed to be a dearth of technical analysts. My aim here is to provide my view of technical analysis that is both intriguing and misunderstood by many. I like to refer to it as the black magic of stock market analysis.
Email - info@thevoodooanalyst.com
© 2015 Copyright The Voodoo Analyst - All Rights Reserved
Disclaimer: The above is a matter of opinion provided for general information purposes only and is not intended as investment advice. Information and analysis above are derived from sources and utilising methods believed to be reliable, but we cannot accept responsibility for any losses you may incur as a result of this analysis. Individuals should consult with their personal financial advisors.
Austin Galt Archive |
© 2005-2022 http://www.MarketOracle.co.uk - The Market Oracle is a FREE Daily Financial Markets Analysis & Forecasting online publication.