Corporate Earnings Expectations Are Too High- Prepare for More Downside
Stock-Markets / Stock Market Valuations Jun 27, 2008 - 08:09 PM GMTBy: Hans_Wagner
 We are about to enter the second quarter 2008 earnings season. If you want to beat the market, it important to have a well founded perspective on earnings expectations. Understanding the importance of earnings is critical if you wish to learn to invest.
Since the U.S. is in a recession, it is normal to expect the reported earnings to reflect the slowing economy. However, a number of analysts are still forecasting a higher PE ratio. Is this realistic and a good basis to make investing decisions?
What History Tells Us
Price earnings ratios and earnings expectations drive stock prices. Over time P/E ratios and earnings expectations expand and contract, reverting to the mean.
Between 1973 and 2000, rising price-to-earnings (P/E) multiples drove the market's growth. The bullish psychology underlying much of that market activity reflected a mistaken belief among many investors that the Internet age had so changed the economic fundamentals that historic ratios were irrelevant and could be ignored.
This belief in a paradigm shift generated P/E multiples that reached a high of around 25 at the stock market's 2000 peak, compared with a long-run average of 14. The four-year bear market decline that followed caused P/E ratios to revert to levels more in line with the long-run average. Earnings also fell, as companies experienced a decline in profits associated with a weakening economy. Also, many of the high priced companies had little or no earnings. Many of them went out of business.
The P/E ratios of the 2004–07 stock market rally remained close to levels seen in the late 1960s, when interest rates were also relatively low. Instead, strong corporate earnings drove the market's growth.
According to a report titled “ Preparing for a Slump in Earnings ” from McKinsey, between 2004 and 2007, the earnings of S&P 500 companies as a proportion of GDP expanded to around 6 percent, compared with a long-run average of around 3 percent, with the highest increase in the financial and energy sectors.
This growth in earnings was primarily driven by increased sales. According to McKinsey, expansion of margins was not a significant contributor to overall earnings growth. These revenues were fueled by the expansion of consumer credit. This is the same credit that is currently causing the collapse of the credit markets.
Current Earnings Expectations
Since the U.S, is experiencing a recession and we are in a bear market, investors are very interested in where earnings and P/E ratios are likely to go.
The financial sector has led with lower earnings expectations as these firms come to grips with the excesses of the credit markets over the last several years. This sector comprises about 17% of the S&P 500, so it can have a significant influence on the performance of the market.
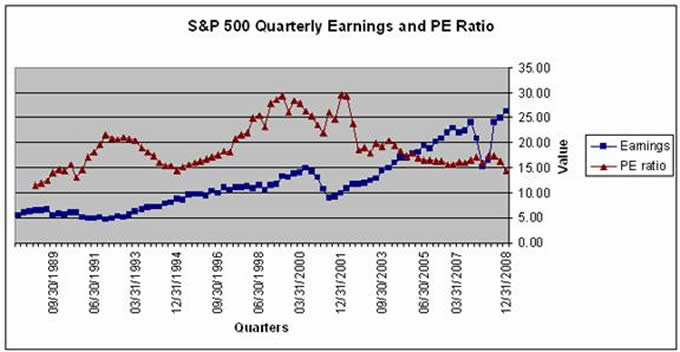
To get another perspective let's take a look at data from Standard & Poor's. They maintain a database of S&P 500 quarterly Earnings and P/E Ratio that goes back till 1988 and includes projections for the rest of 2008. You can access it here . The chart below is from that Standard & Poor's data. To derive the P/E ratio the price of the S&P 500 is held constant as of the close on March 31, 2008 at 1322.70. The S&P 500 is trading below 1300 as of this writing.

From this source, it shows that Standard & Poor's expects a brief earnings dip in the fourth quarter of 2007 with the earnings trend returning to the prior growth pattern by the second quarter of 2008. Remember that much of the growth in earnings was driven by the growth in revenues which was fueled by the rapid expansion of credit that is now contracting significantly. The problem is this earnings forecast doesn't seem very logical nor does it follow history.
According to McKinsey & Company, the strategic consulting firm, in order for overall S&P 500 earnings to reach the long-run average proportion of GDP, profits would have to fall 20 percent from their 2007 levels. This excludes the financial and energy sectors, so we get a better focus on the underlying economy. Moreover, earnings would have to drop up to 40 percent to reach the lower levels in previous economic cycles.
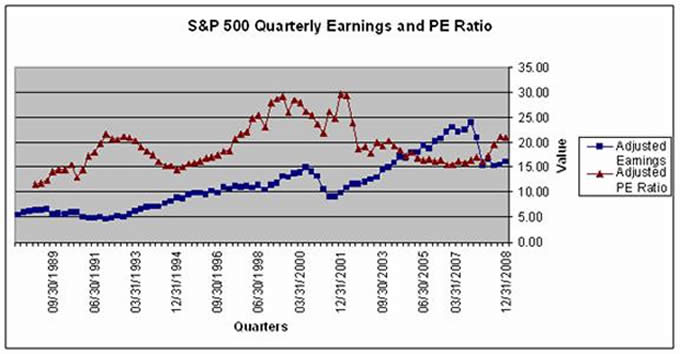
The chart below adjusts the S&P earnings estimates to reflect the mid point of McKinsey's analysis. A 30% drop in earnings and then a more normal recovery over the next 3 quarters of 2008.
In the chart below the P/E ratio expands during the earnings decline and bear market, since the price of the S&P 500 was held constant. More likely the P/E ratio would either remain the same or fall. In either case the price of the S&P 500 would fall. For example, if the P/E ratio remained at 16, above the average of 14, and the earnings for 2008 reflected the forecast ($61.90 for the year) in the chart the S&P 500 would be 990.

Is it different this Time
There are some analysts that claim that this time it is different. The global economy will help hold up the U.S. economy and corporate earnings. There is some truth to this as the world's economies are more closely connected than ever before. This means that companies that have a global presence have diversified their exposure to the problems caused by one country's economy.
Other economists point to the weaker dollar, which makes U.S. exports less expensive and, therefore, more competitive in the world markets. It also encourages people from outside the U.S. to come to the country and buy goods, as they are less expensive as well.
On the other hand, if the recession in the U.S. causes consumers to spend less, it is will affect the economies of countries that derive their strength from this spending.
As a result, it is reasonable to assume the U.S. will experience a 30% drop in earnings this economic cycle. Moreover, it is possible the U.S. will experience even weaker earnings for longer than many expect. Especially, if the consumer withholds their spending for a longer period of time. After all, one of the primary sources of the consumer's spending was the availability of cash from cheap credit. Now it is no longer available. It is possible this lower level of spending could continue for longer than many think.
What's an Investor to Do?
The risk for investors is more to the down side than to the upside. As a result, it will pay to be cautious as we enter earnings season. The recent market weakness is a reflection that the financial and homebuilding sectors have not yet bottomed.
Investors should be prepared for down side earnings surprises, which are likely to cause the markets to fall. Use the results presented by quality companies to evaluate the strength of individual companies for possible purchase, especially those that have significant global exposure. Be sure to use risk protection techniques such as stop losses, protective put options and covered calls. Opportunities to buy will become available, but it does not pay to be early.
To learn more about how to understand earnings and how to benefit from your analysis I suggest reading:
Ahead of the Curve: A Commonsense Guide to Forecasting Business and Market Cycles by Joe Ellis is an excellent book on how to predict macro moves of the market
How To Make Money In Stocks: A Winning System in Good Times or Bad, 3rd Edition by William J. O'Neil is an excellent book on how to pick winning stocks. Mr. O'Neil is the founder of Investors Business Daily a national financial newspaper read by many professional traders and investors.
By Hans Wagner
tradingonlinemarkets.com
My Name is Hans Wagner and as a long time investor, I was fortunate to retire at 55. I believe you can employ simple investment principles to find and evaluate companies before committing one's hard earned money. Recently, after my children and their friends graduated from college, I found my self helping them to learn about the stock market and investing in stocks. As a result I created a website that provides a growing set of information on many investing topics along with sample portfolios that consistently beat the market at http://www.tradingonlinemarkets.com/
Hans Wagner Archive |
© 2005-2022 http://www.MarketOracle.co.uk - The Market Oracle is a FREE Daily Financial Markets Analysis & Forecasting online publication.


