Crude Oil Unsustainable Advance and Stock Market Double Non-Confirmation
Commodities / Crude Oil Jun 28, 2008 - 10:44 AM GMTBy: Tim_Wood

 For weeks now one of the major topics in the news and amongst the politicians is the price of oil. The republicans want to begin more deep water drilling and open up parts of Alaska to drilling that has historically been protected. The democrats have introduced a bill to limit speculation to only those that are end-users of oil. It seems that the word speculator is becoming a four-letter word. I also hear talk of conspiracy and manipulation by the masters of the world.
First, let me state that I personally agree with opening up more drilling and that I do not support any limitations on the markets or speculators because the role of the speculator is essential to even have a market. If there were no speculators, there would not be a market. Think about it. When you take a long position in stocks, gold, bonds, soybeans, your 401k or anything else, are you not speculating that it will go up? By the same token if you short a particular instrument, are you not speculating that it will goes down? The bottom line is that if we are participants in any market we are speculators and as a result, speculators make the market.
As for oil, between 1999 and 2001 major long-term cycle lows occurred in commodities. One after another the cycles in commodities hit bottom and turned up. As these cycles turned up, new trends slowly began to emerge. In the beginning there was very little interest in investing in commodities because they had been in bear markets and/or basically flat. Over time, these new trends began to attract more and more attention. As a result, more people began to jump on the bandwagon, which in turn strengthens the new trend which in turn draws even more attention. When new trends are established the news is relatively quiet as to why this new trend has begun. But, as that trend begins to strengthen we begin to hear that it's because of this reason or that, which in many cases merely serves as a justification for the price advance. If an advance can continue long enough it will begin to draw even more attention because the “speculators” all want a piece of the pie. It is at this stage of the game that people begin to crawl out of the woodworks to get on board and it is this rampant influx of speculation that ultimately drives a trend parabolic.
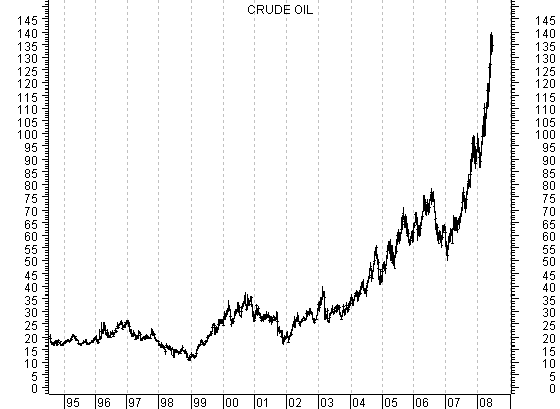
I have included a chart of crude oil going back to late 1994 below. I think that one would be hard pressed to say that this advance has not gone parabolic or vertical. Any parabolic advance is simply a result of irrational behavior that is driven by a high degree of market participants speculating in that market. This is the stage of the game where speculation runs wild. Everyone has bought into the belief that everything has now changed, that higher prices will prevail until the end of time, that this time is definitely different and that they must get on board in order to stake their claim. This is what I term the “all in phase.”

When I say “all in” what I mean is that price will continue its parabolic advance until the allure of speculative profits have pulled the masses in. Then, once the mass inflow of speculation begins to fade, the momentum of the move begins to fade as well. It is at that point that the emotionally driven speculative parabolic advance peaks. Then, without the massive inflow of new buyers all of a sudden that price level can no longer be supported. It is then at this point that prices collapse.
Now, this is not to say that there aren't also underlying fundamental reasons behind a price advance because obviously there are. But, the underlying fundamentals are never significant enough to support a move when it goes into a vertical parabolic spike. Think about, what has changed since 1999 to justify a 1,272 percent advance? That's right from $10.35 in 1999 to present is a 1,272 percent advance. Also, what has changed since the 2007 low at $49.90 to justify the 185 percent advance since then? This move is simply not sustainable and it will end like all other parabolic advances in the past have ended. Remember the housing bubble. Remember the Nasdaq bubble. Remember the sugar bubble in the early 1970's. Remember reading about the tulip mania in 1636. It's all the same. It's all an emotionally driven allure for speculative profits.
At this stage of the game, I still cannot yet say that the advance in oil is over. For that I have to watch my indicators as well as for specific cyclical developments and structural breakdowns that have not yet occurred. But, I can without a doubt tell you that we are in a parabolic spike, that we should be nearing the “all in phase” and that a collapse in oil prices will follow. In the meantime, the key for me in identifying this top is to watch my ever so important Cycle Turn Indicator. Once this occurs along with the first sign of a cyclical top I would not want any part of the long side on oil. In fact, once I see the right setup develop oil might just be the best short sell since the Nasdaq decline between 2000 and into 2002.
As for the stock market, there were some who proclaimed that when the averages moved above their February highs that this signaled a so called “Dow theory buy signal.” I have maintained that this was incorrect and that from a Dow theory perspective, the bearish primary trend change that occurred on November 21, 2007 remained fully intact. My read of the Dow theory has obviously now been proven correct.

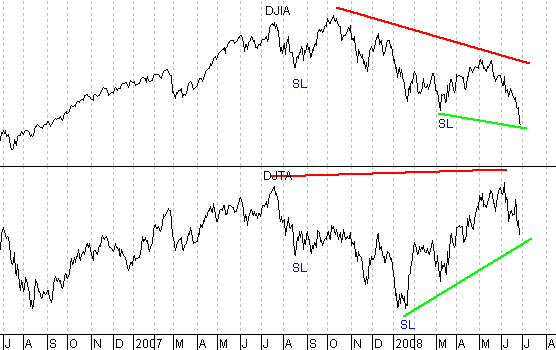
At present, we have two major Dow theory non-confirmations in place. One of these non-confirmations recently occurred when the Transport's moved to new highs in early June, while the Industrials failed to confirm. This can be seen on the chart above and is noted in red. In the wake of this upside non-confirmation, the Industrials have now moved below their March closing low. But, with the Transports still above their corresponding secondary low point, which occurred in January, we now also have a longer-term downside non-confirmation in place, which is noted in green. Non-confirmations serve as warnings and with both an upside as well as a downside non-confirmation in place we definitely have a tug of war going on between the bear and the bull. Nonetheless, according to Dow theory, once a trend is authoritatively established, as was the case on November 21, 2008, that trend must be considered to still be intact until it is reversed. To date, nothing has occurred to reverse the bearish primary trend that was established last November.
I have begun doing free Friday market commentary that is available at www.cyclesman.com/Articles.htm so please begin joining me there. Should you be interested in more in depth analysis that provides intermediate-term turn points utilizing the Cycle Turn Indicator, which has done a fabulous job, on stock market, the dollar, bonds, gold, silver, oil, gasoline, and more, those details are available in the research letter and short-term updates. In the June research letter I specifically covered commodities in great details and outline the parameters and benchmarks for the coming months. A subscription includes access to the monthly issues of Cycles News & Views covering the Dow theory, and very detailed statistical based analysis plus updates 3 times a week.
By Tim Wood
Cyclesman.com
© 2008 Cycles News & Views; All Rights Reserved
Tim Wood specialises in Dow Theory and Cycles Analysis - Should you be interested in analysis that provides intermediate-term turn points utilizing the Cycle Turn Indicator as well as coverage on the Dow theory, other price quantification methods and all the statistical data surrounding the 4-year cycle, then please visit www.cyclesman.com for more details. A subscription includes access to the monthly issues of Cycles News & Views covering the stock market, the dollar, bonds and gold. I also cover other areas of interest at important turn points such as gasoline, oil, silver, the XAU and recently I have even covered corn. I also provide updates 3 times a week plus additional weekend updates on the Cycle Turn Indicator on most all areas of concern. I also give specific expectations for turn points of the short, intermediate and longer-term cycles based on historical quantification.
Tim Wood Archive |
© 2005-2022 http://www.MarketOracle.co.uk - The Market Oracle is a FREE Daily Financial Markets Analysis & Forecasting online publication.


