


Stock Market Primary V Continues
Stock-Markets / Stock Markets 2015 Oct 17, 2015 - 06:18 PM GMTBy: Tony_Caldaro

 The market started the week at SPX 2015. After a rally to SPX 2022 on Tuesday the market pulled back to 1991 by Wednesday. After that, helped by two gap openings, the market rallied Thursday/Friday to post new uptrend highs at SPX 2034. For the week the SPX/DOW gained 0.85%, the NDX/NAZ gained 1.40%, and the DJ World gained 0.50%. On the economic front reports continue to be mixed to negative. On the uptick: retail sales, consumer sentiment, plus weekly jobless claims improved. On the downtick: the CPI/PPI, NY/Philly FED, industrial production, capacity utilization, the WLEI and GDPn. Next week lots of Housing reports, Leading indicators, and the ECB meets.
BIG PICTURE
With the stock charts monthly chart only going back to 1980 the labeling of the waves can be confusing for some, as one can see a Primary III lasting 18 years, (1982-2000), and now a Primary III lasting only four years, (2011-2015). One may think how is that possible? Actually, it is not only possible but somewhat expected when one reviews the last 100 years of stock market data rather than just 35 years.

The chart above displays the market activity in the DOW from 1900-2008. During this period of time the stock market completed a bullish Grand super cycle in 1929, and a nearly 90% decline bearish Grand super cycle into 1932. From that 1932 low the next 200+ year bullish Grand super cycle began.
Grand super cycles divide into five Super cycle waves, with the three bullish waves (SC 1, SC 3 and SC 5) lasting about 70+ years. The bullish SC 1, noted by the Cycle wave [5] top in 2007, started in 1932, and lasted 75 years. This was followed by a bearish 50+% decline into 2009 for SC 2. After that low in March 2009 the market started its next 70+ year bullish SC 3. This is easily observed with the up-to-date monthly chart that follows.
A 70+ year bullish Super cycle unfolds in five Cycle waves. The three bullish Cycle waves (C 1, C 3, and C 5) can last from 5 years to 30+years. During the 1932-2007 SC 1, the Cycle waves were as follows: C [1] 1932-1937, C [2] 1937-1942, C [3] 1942-1973, C [4] 1973-1974, C [5] 1974-2007. Notice Cycle [1] only took 5 years, Cycle [3] 31 years, and Cycle [5] 33 years.
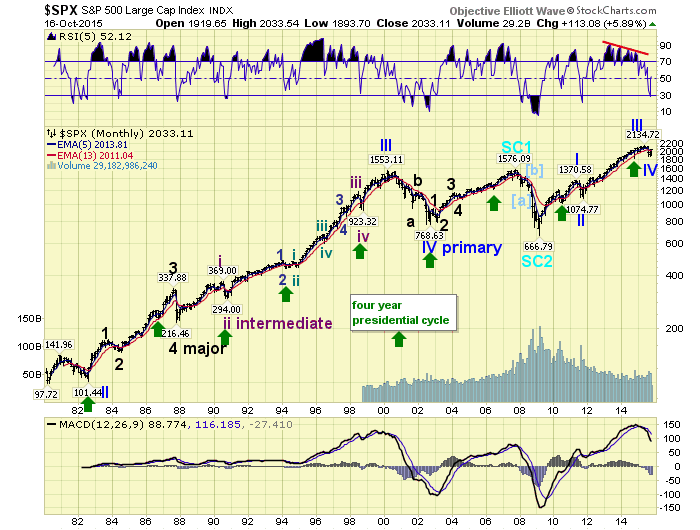
Each bullish Cycle wave divides into five Primary waves. Obviously a Cycle wave of only five years will have much shorter Primary waves than one of 30+ years. It is therefore very important to know where the market is in regard to the big picture, before trying to anticipate where it is now, where it is heading, and how it might get there.
With SC 1 as a template we have been expecting a relatively short Cycle wave [1] bull market from the March 2009 SC 2 low. At first we thought it might last five years, then eight years, now we would not be surprised if it ended 2015/2016. The important point is that we knew it would not last 30+ years. That is expected for Cycle wave [3]. After the current bull market tops, a one to two year Cycle wave [2] bear market will follow.
LONG TERM: bull market
We continue to track the wave formation of Cycle wave [1] of Super cycle wave 3. As noted above bullish Cycle waves unfold in five Primary waves. During this bull market Primary waves I and II completed in 2011, and Primary waves III and IV completed in 2015. Primary wave V, the fifth and final wave, is currently underway.
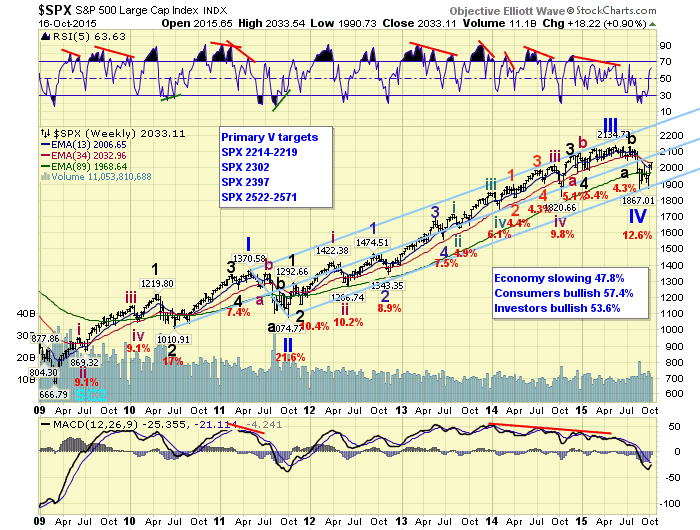
We are expecting Primary wave V to complete at one of the price targets posted on the weekly chart above. The most obvious target would be SPX 2214-2219, if it completes in one uptrend. When it does conclude a Cycle wave [2] bear market should then follow, with the market losing between 45% and 50% of its value. This is likely to take one to two years. After that a 30+ year Cycle wave [3] should get underway, with bull/bear markets along the way, carrying the markets to unbelievable heights. Exciting times ahead!
MEDIUM TERM: uptrend
After the Primary III high in May at SPX 2135 we observed a three trend a-b-c decline to 1867 by August. We then waited for a test of that low before firmly labeling Primary IV at that SPX 1867 low. The main thing we were watching was to observe alternation between the Primary II five trend elongated flat, and Primary IV. With Primary IV ending as a zigzag, alternation was achieved by the market.
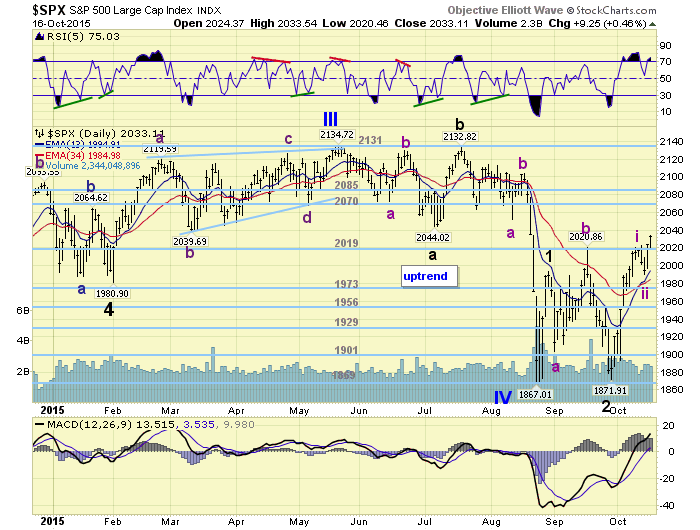
Since impulsive primary waves unfold in five Major waves, we labeled the first rally off the SPX 1867 low to SPX 1993 as Major wave 1. Then Major wave 2 unfolded in an odd irregular zigzag ending at SPX 1872. After that low, right at the end of September, Major wave 3 kicked off to the upside. Should Major wave 3 travel 1.618 times Major 1, then its target would be SPX 2076. If 2.0 times Major 1, its target is SPX 2124. Medium term support is at the 2019 and 1973 pivots, with resistance at the 2070 and 2085 pivots.
SHORT TERM
For Major 1 we counted a simple five waves up from SPX 1867: 1915-1880-1990-1948-1993. For Major wave 3 we have counted nine waves up for just Intermediate wave i: 1917-1894-1992-1972-1999-1976-2020-2006-2022. Then after an Intermediate wave ii pullback to SPX 1991, we have counted just one wave up for Intermediate iii thus far: 2034. This one wave could have subdivided into five Minute waves: 2008-1997-2031-2020-2034 thus far. So this first wave up should be close to completing. When it does we would expect about a 15-20 point pullback before Intermediate iii heads higher.
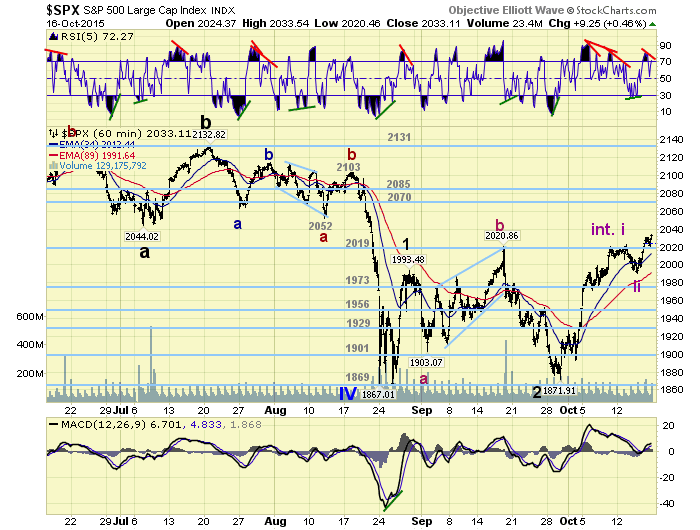
Short term support is at the 2019 pivot and SPX 2000, with resistance at SPX 2040 and the 2070 pivot. Short term momentum ended the week with a negative divergence. Best to your trading!
FOREIGN MARKETS
Asian markets were mixed on the week but gained 1.1%.
European markets were mostly higher and gained 0.2%.
The Commodity equity group were all lower and lost 2.0%.
The DJ World index is uptrending and gained 0.5%.
COMMODITIES
Bonds are uptrending and gained 0.4%.
Crude is also uptrending but lost 3.6%.
Gold is uptrending and gained 2.4%.
The USD reversed into a downtrend and lost 0.2%.
NEXT WEEK
Monday: the NAHB and a speech from FED governor Brainard at 10am. Tuesday: Building permits, Housing starts, and speeches from FED governor Powell and FED chair Yellen. Thursday: the ECB meets, weekly Jobless claims, the FHFA, Existing home sales, and Leading indicators. Best to your weekend and week!
CHARTS: http://stockcharts.com/public/1269446/tenpp
After about 40 years of investing in the markets one learns that the markets are constantly changing, not only in price, but in what drives the markets. In the 1960s, the Nifty Fifty were the leaders of the stock market. In the 1970s, stock selection using Technical Analysis was important, as the market stayed with a trading range for the entire decade. In the 1980s, the market finally broke out of it doldrums, as the DOW broke through 1100 in 1982, and launched the greatest bull market on record.
Sharing is an important aspect of a life. Over 100 people have joined our group, from all walks of life, covering twenty three countries across the globe. It's been the most fun I have ever had in the market. Sharing uncommon knowledge, with investors. In hope of aiding them in finding their financial independence.
Copyright © 2015 Tony Caldaro - All Rights Reserved Disclaimer: The above is a matter of opinion provided for general information purposes only and is not intended as investment advice. Information and analysis above are derived from sources and utilising methods believed to be reliable, but we cannot accept responsibility for any losses you may incur as a result of this analysis. Individuals should consult with their personal financial advisors.
Tony Caldaro Archive |
© 2005-2022 http://www.MarketOracle.co.uk - The Market Oracle is a FREE Daily Financial Markets Analysis & Forecasting online publication.