Stock Market Lots of Downside Ahead, Major Tops and Bottoms Analysis Since 1950
Stock-Markets / Stock Markets 2015 Oct 18, 2015 - 03:46 PM GMTBy: Submissions
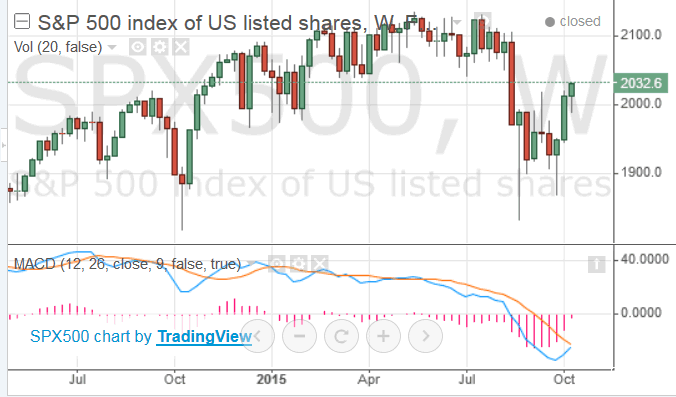
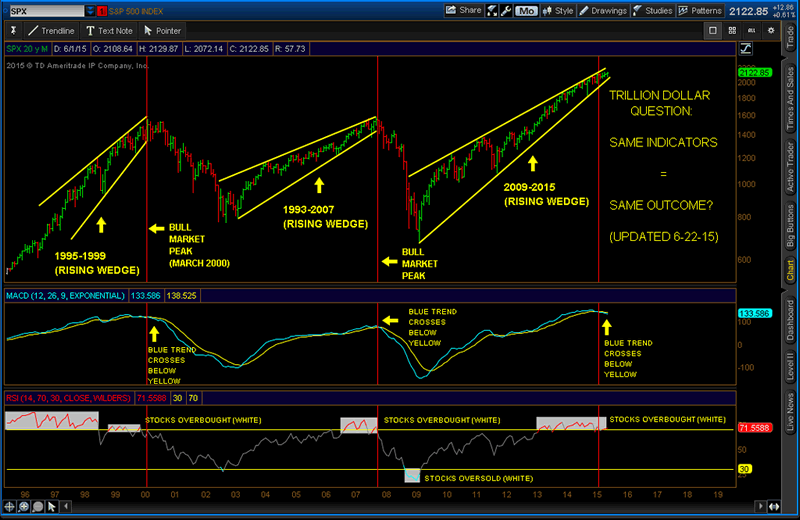
 With the recent melt down in global markets, it would be prudent to look back at historical data on the US market to see where we stand. To do this I look at major tops and bottoms in the S & P 500 obtained from weekly historical data from Yahoo Finance since 1950. The first table below shows major tops and bottoms in the S and P 500 relative to the average and standard deviation:
Table 1: S&P 500 Tops/Bottoms, Average & Standard Deviation over Time
Date |
S & P 500 Top / Bottom |
Average |
Standard Deviation |
November 25, 1968 |
108.37 |
55.37 |
24.92 |
May 18, 1970 |
72.25 |
58.26 |
26.21 |
January 2, 1973 |
119.87 |
62.90 |
28.12 |
September 30, 1974 |
62.34 |
65.38 |
28.78 |
December 22, 1980 |
136.57 |
72.26 |
29.69 |
August 2, 1982 |
103.71 |
74.74 |
31.00 |
August 17, 1987 |
335.9 |
90.93 |
53.55 |
30-Nov-87 |
223.92 |
92.37 |
55.95 |
13-Jul-98 |
1186.75 |
181.77 |
203.72 |
31-Aug-98 |
973.89 |
184.22 |
208.73 |
20-Mar-00 |
1527.46 |
218.64 |
282.52 |
2-Apr-01 |
1128.43 |
242.13 |
324.34 |
14-May-01 |
1291.96 |
244.38 |
327.45 |
10-Sep-01 |
965.8 |
250.33 |
334.93 |
11-Mar-02 |
1166.16 |
258.34 |
343.62 |
30-Sep-02 |
800.58 |
266.00 |
349.94 |
8-Oct-07 |
1561.8 |
346.50 |
427.52 |
2-Mar-09 |
683.38 |
366.81 |
443.71 |
19-Apr-10 |
1217.28 |
379.11 |
448.71 |
28-Jun-10 |
1022.58 |
381.39 |
449.82 |
2-May-11 |
1340.2 |
392.94 |
457.43 |
15-Aug-11 |
1123.53 |
397.09 |
460.40 |
13-Jul-15 |
2126.64 |
474.27 |
543.97 |
Table 2: No of Standard Deviations from the Average at Major S&P 500 Tops/Bottoms and Subsequent Returns from Tops to Bottoms and Bottoms to Tops
Date |
No of Standard Deviations from Average |
% Change |
November 25, 1968 |
2.13 |
-33% |
May 18, 1970 |
0.53 |
66% |
January 2, 1973 |
2.03 |
-48% |
September 30, 1974 |
-0.11 |
119% |
December 22, 1980 |
2.17 |
-24% |
August 2, 1982 |
0.93 |
224% |
August 17, 1987 |
4.57 |
-33% |
30-Nov-87 |
2.35 |
430% |
13-Jul-98 |
4.93 |
-18% |
31-Aug-98 |
3.78 |
57% |
20-Mar-00 |
4.63 |
-26% |
2-Apr-01 |
2.73 |
14% |
14-May-01 |
3.20 |
-25% |
10-Sep-01 |
2.14 |
21% |
11-Mar-02 |
2.64 |
-31% |
30-Sep-02 |
1.53 |
95% |
8-Oct-07 |
2.84 |
-56% |
2-Mar-09 |
0.71 |
78% |
19-Apr-10 |
1.87 |
-16% |
28-Jun-10 |
1.43 |
31% |
2-May-11 |
2.07 |
-16% |
15-Aug-11 |
1.58 |
89% |
13-Jul-15 |
3.04 |
? |
So the question begs what does it mean for today’s market? We have already started breaking down from over extended levels. The current market average is about 474 and standard deviation is 544. Here are some scenarios below:

Table 3: S&P 500 Possible Scenarios
Market Average (MA)+ Standard Deviation (SD) |
S & P 500 Level |
MA |
474 |
MA + 1 SD |
1018 |
MA + 2 SD |
1562 |
MA + 3 SD
|
2106 |
The bottom line is folks we are historically over extended. We could now correct to at least 2 standard deviations above the long term average which is close to the 2008 highs near 1575 or to a standard deviation (#stdev) above the long term average as was the case at the 2008 lows near 1018 or to the long term average near 474 which we haven’t revisited since 1974. Only time will tell.

http://rajveersmarketviews.blogspot.co.uk/
Rajveer Rawlin received his MBA in finance from the Cardiff Metropolitan University, Wales, UK. He is an avid market watcher having followed capital markets in the US and India since 1993. His research interests includes areas of Capital Markets, Banking, Investment Analysis and Portfolio Management and has over 20 years of experience in the above areas covering the US and Indian Markets. He has several publications in the above areas. The views expressed here are his own and should not be construed as advice to buy or sell securities.
© 2015 Copyright Rajveer Rawlin - All Rights Reserved
Disclaimer: The above is a matter of opinion provided for general information purposes only and is not intended as investment advice. Information and analysis above are derived from sources and utilising methods believed to be reliable, but we cannot accept responsibility for any losses you may incur as a result of this analysis. Individuals should consult with their personal financial advisors.
© 2005-2022 http://www.MarketOracle.co.uk - The Market Oracle is a FREE Daily Financial Markets Analysis & Forecasting online publication.


