S&P 500 Stock Market Index Potential Near-Term Double Bottom Pattern
Stock-Markets / US Stock Markets Jun 30, 2008 - 12:03 PM GMTBy: Mike_Paulenoff

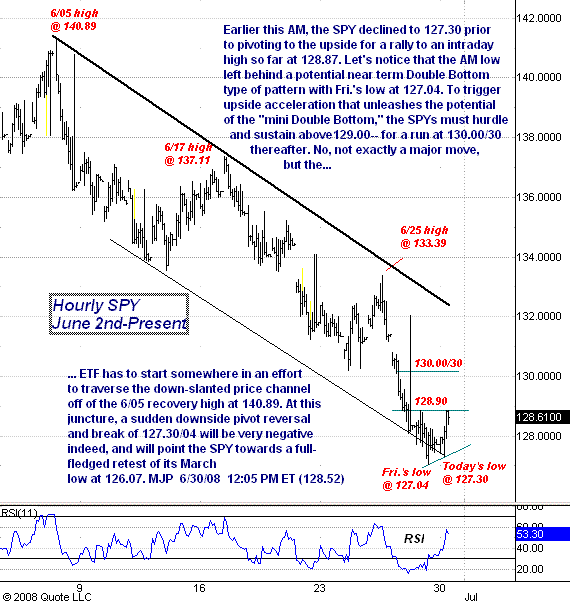
 Earlier this AM, the SPY declined to 127.30 prior to pivoting to the upside for a rally to an intraday high so far at 128.87. Let's notice that the AM low left behind a potential near term Double Bottom type of pattern with Fri.'s low at 127.04. To trigger upside acceleration that unleashes the potential of the "mini Double Bottom," the SPYs must hurdle and sustain above129.00-- for a run at 130.00/30 thereafter.
No, not exactly a major move, but the ETF has to start somewhere in an effort to traverse the down-slanted price channel off of the 6/05 recovery high at 140.89. At this juncture, a sudden downside pivot reversal and break of 127.30/04 will be very negative indeed, and will point the SPY towards a full- fledged retest of its March low at 126.07.

Sign up for a free 15-day trial to Mike's ETF Trading Diary today.
By Mike Paulenoff
Mike Paulenoff is author of the MPTrader.com (www.mptrader.com) , a real-time diary of Mike Paulenoff's trading ideas and technical chart analysis of Exchange Traded Funds (ETFs) that track equity indices, metals, energy commodities, currencies, Treasuries, and other markets. It is for traders with a 3-30 day time horizon, who use the service for guidance on both specific trades as well as general market direction
© 2002-2007 MPTrader.com, an AdviceTrade publication. All rights reserved. Any publication, distribution, retransmission or reproduction of information or data contained on this Web site without written consent from MPTrader is prohibited. See our disclaimer.
Mike Paulenoff Archive |
© 2005-2022 http://www.MarketOracle.co.uk - The Market Oracle is a FREE Daily Financial Markets Analysis & Forecasting online publication.


