


Stock Market Nearing New Highs
Stock-Markets / Stock Markets 2015 Oct 31, 2015 - 06:27 PM GMTBy: Tony_Caldaro

 The market started the week at SPX 2075. After drifting lower on Monday the market declined, aided by a gap down opening, to SPX 2059 on Tuesday. Then the market rallied to SPX 2085 on Wednesday ahead of the FOMC statement. After the statement the market declined to SPX 2063, then rallied to a new uptrend high at SPX 2090 by the close. On Thursday and Friday the rally continued as the SPX hit 2094. Then a late afternoon pullback ended the week at SPX 2079. For the week the SPX/DOW gained 0.15%, the NDX/NAZ gained 0.45%, and the DJ World index lost 0.2%. On the economic front reports continue to be lackluster. On the uptick: Case-Shiller, personal income/spending, the PCE, the Chicago PMI, and GDPn. On the downtick: new/pending home sales, durable goods, consumer confidence/sentiment, Q3 GDP, the WLEI, plus weekly jobless claims rose. Next week’s reports will be highlighted by the monthly Payrolls report, the ISM’s and Auto sales.
LONG TERM: bull market
We have been expecting this Cycle [1] bull market to unfold in five Primary waves. A nine wave Primary I completed in May 2011, then an elongated flat Primary wave II ended in October 2011. Primary III extended for 21 waves and topped in May 2015. Then Primary IV was a three wave zigzag, alternating with Primary II, bottoming in August 2015. Since that low Primary V has been underway.
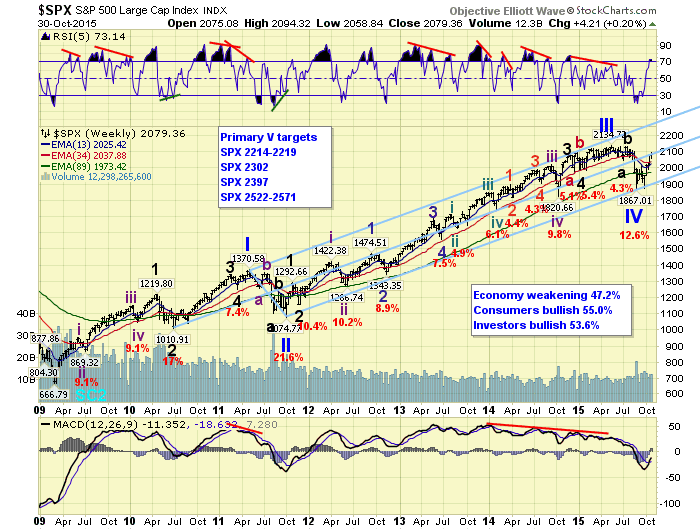
During the past three decades, a significant fifth wave has ended its longer term five wave pattern if the first uptrend makes new highs. If it does not make new highs, then the fifth wave itself divides into a five wave pattern of its own until the bull market concludes. The current uptrend, off the Primary IV low, is about 2% from the SPX 2135 high. Should that high be exceeded during this first uptrend, the bull market will likely conclude when the uptrend ends. The weekly chart above displays the potential price targets for the high of Primary V.
MEDIUM TERM: uptrend
While there has been some debate about where the recent Primary wave IV ended, and for that matter if it has ended at all. OEW is quite clear, and quantitative, in determining exactly where trends begin and end. This is one of the features that sets it apart from conventional EW analysis. There are many others. While the recent Primary IV August low may look a bit strange on the SPX chart. A quick glance at the DOW/NDX/NAZ displays a much cleaner pattern.
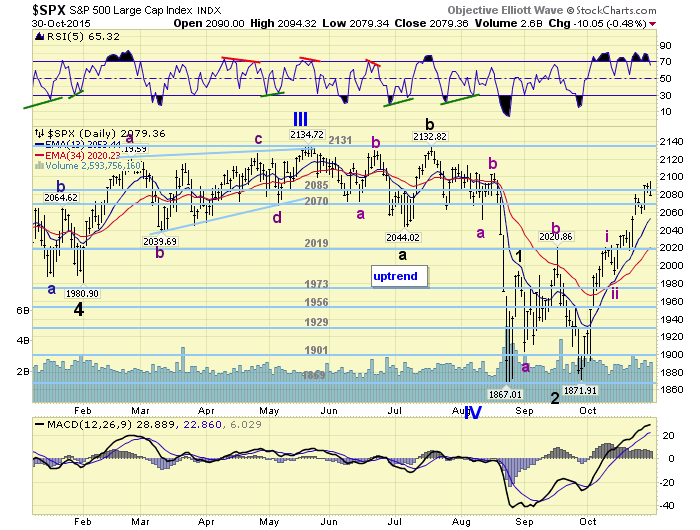
After the SPX 1867 Primary IV low the market continued to be quite volatile for the next month. The first rally off that low took only three days and hit SPX 1993. The activity that followed took three weeks and bottomed at SPX 1872. Primary V should unfold in five Major waves. We labeled the SPX 1993 high as Major wave 1, and the SPX 1872 low as Major wave 2. After that Major wave 3 kicked off to the upside, and is already approaching all time highs. When Major 3 completes, Major 4 should have a steep pullback and then Major 5 should complete the uptrend. Medium term support is at the 2070 and 2019 pivots, with resistance at the 2085 and 2131 pivots.
SHORT TERM
After the SPX 1872 Major wave 2 low we started labeling Major wave 3 with five Intermediate waves. Intermediate wave i unfolded in five Minor waves and completed at SPX 2022: 1917-1894-1992-1972-2022. After Intermediate wave ii declined to SPX 1991, Int. wave iii began. Thus far we have labeled four Minor waves complete, with the fifth underway: 2039-2017-2080-2059-2094?
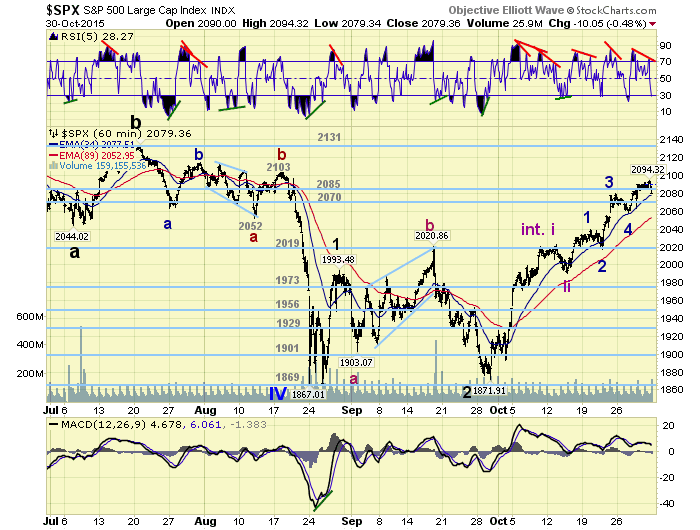
When Minor wave 5 concludes it will end Intermediate wave iii. Then an Intermediate iv pullback should follow, similar to the Int. ii pullback. After it concludes, Int. wave v should challenge, or exceed, the all time high at SPX 2135 to complete Major wave 3. Then a sharp Major 4 pullback, largest since Major 2, should follow. After that a Major wave 5 rally should take the market higher, and probably end the bull market when it ends. Short term support is at the 2070 pivot and SPX 2059, with resistance at the 2085 pivot and SPX 2100. Short term momentum ended the week oversold.
FOREIGN MARKETS
The Asian markets were mostly lower on the week for a net loss of 1.8%.
The European markets were mostly lower as well and lost 0.6%.
The Commodity equity group were all lower on the week losing 3.3%.
The DJ World index is still in an uptrend but lost 0.2%.
COMMODITIES
Bonds may confirm a downtrend soon and lost 0.7% on the week.
Crude is trying to confirm an uptrend and gained 4.2% on the week.
Gold may confirm a downtrend soon and lost 1.9% on the week.
The USD is uptrending but lost 0.2% on the week.
NEXT WEEK
Monday: ISM manufacturing and Construction spending at 10am. Tuesday: Factory orders and Auto sales. Wednesday: ADP, the Trade deficit, ISM services, Congressional testimony from FED chair Yellen, and a speech from FED vice chair Fischer. Thursday: weekly Jobless claims, and a speech from FED governor Tarullo. Friday: monthly Payrolls and Consumer credit.
CHARTS: http://stockcharts.com/public/1269446/tenpp
After about 40 years of investing in the markets one learns that the markets are constantly changing, not only in price, but in what drives the markets. In the 1960s, the Nifty Fifty were the leaders of the stock market. In the 1970s, stock selection using Technical Analysis was important, as the market stayed with a trading range for the entire decade. In the 1980s, the market finally broke out of it doldrums, as the DOW broke through 1100 in 1982, and launched the greatest bull market on record.
Sharing is an important aspect of a life. Over 100 people have joined our group, from all walks of life, covering twenty three countries across the globe. It's been the most fun I have ever had in the market. Sharing uncommon knowledge, with investors. In hope of aiding them in finding their financial independence.
Copyright © 2015 Tony Caldaro - All Rights Reserved Disclaimer: The above is a matter of opinion provided for general information purposes only and is not intended as investment advice. Information and analysis above are derived from sources and utilising methods believed to be reliable, but we cannot accept responsibility for any losses you may incur as a result of this analysis. Individuals should consult with their personal financial advisors.
Tony Caldaro Archive |
© 2005-2022 http://www.MarketOracle.co.uk - The Market Oracle is a FREE Daily Financial Markets Analysis & Forecasting online publication.