


Stock Market Minor Correction Imminent
Stock-Markets / Stock Markets 2015 Nov 01, 2015 - 10:30 PM GMTBy: Andre_Gratian

 Current Position of the Market
SPX: Long-term trend - Bull Market
Intermediate trend - SPX has resumed its uptrend in order to complete the last phase of the bull market.
Analysis of the short-term trend is done on a daily basis with the help of hourly charts. It is an important adjunct to the analysis of daily and weekly charts which discusses longer market trends.
MINOR CORRECTION IMMINENT
Market Overview
Last week, SPX pushed a little higher, possibly completing a 5-wave structure from 1990. The high of the week was 1094.32, a little shy of its ideal projection, so there may be another attempt made before the anticipated correction starts.
Friday's close (which was on the low of the day) was well below a congestion level and it looked as if the bears had regained control but, as we will see later when we analyze the hourly chart, this move was not confirmed by the A/Ds which closed positive and exhibited strong positive divergence. Also, neither IWM nor QQQ seemed to be concerned about Monday's opening. Unless some negative news over the week-end triggers additional selling, there is a chance that SPX will make another attempt at reaching its ideal target before the structure is complete!
In August, when the index started its steep correction, it penetrated the bottom trend line of a bullish intermediate channel that started forming in October 2011. By rising to 1094 last week, it has now back-tested the bottom channel line and this, in conjunction with other factors, could halt its uptrend from 1872, at least temporarily. If so, this would bring about the best correction since the beginning of that move.
Intermediate Indicators Survey
Last week, the weekly MACD rose from a late September low of about -33 to -11.44 and increased the range of its histogram, thus retaining its upside momentum.
The weekly SRSI remained at 100 (the top of its range) for the second straight week.
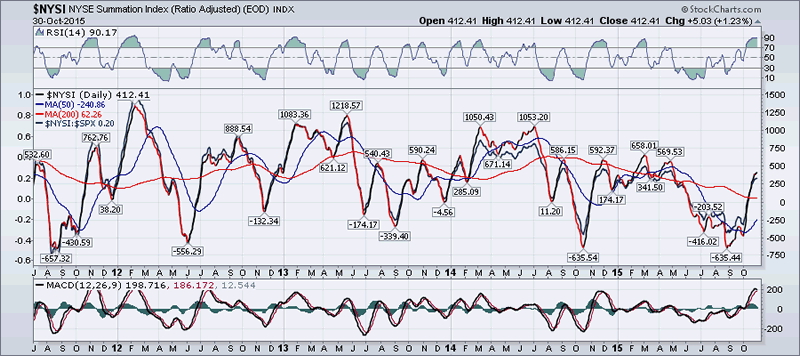
The daily NYAD has lost its upside momentum and has been bunching up near its high for the past few days. The NYSI (courtesy of StockCharts.com) is also reflecting a slower pace by starting to angle over, but it has not yet turned down. It should when we start to correct.
The process of topping is best reflected in the 1X P&F chart of the SPX which shows a lot of churning, and has only been able to increase its range by 4 points in the past two days. Clearly, some distribution is taking place.
Chart Analysis
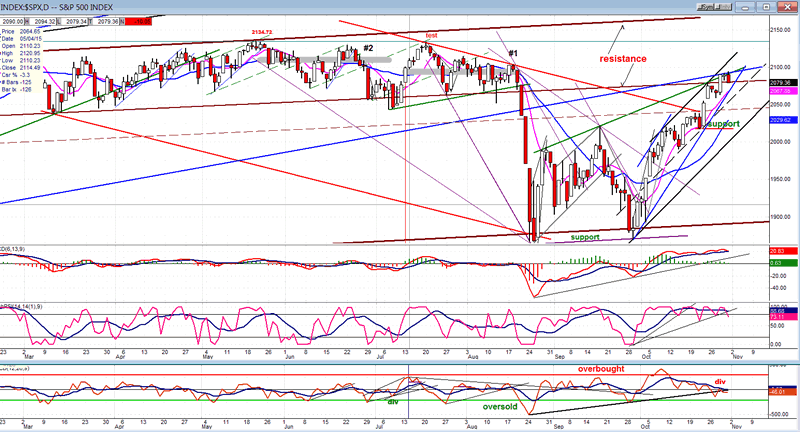
Daily SPX chart (courtesy of QCharts.com, as well as others below).
About two weeks ago, SPX reached the bottom of its red correction channel which corresponded with the first level of overhead resistance. It only hesitated for a few days before driving through, telling us that the price movement, thus far, was not simply an A-B-C corrective wave which would end there; and last week, it pushed higher to back-test the underneath of the intermediate (blue) channel line which had kept prices in an uptrend since October 2011. At the same time, it reached a second level of overhead resistance which is much tougher than the first and which is expected to turn prices back more decisively than at the lower level.
From the August low, the index has created a pattern of trading which can be divided into three phases: (1) The initial uptrend from the low which (2) was re-tested all the way down to the support zone, and (3) what is now the main thrust of the uptrend delineated by the black channel. On Friday, SPX closed down with a candlestick pattern known as "bearish engulfing" suggesting that now the stock or index should start to correct. More often than not, this pattern has indicated that the high of a move has been made. However, I pointed out in the Market Overview that some contra-indications existed which suggest that there was still a chance for the index to make a slightly higher high before reversing. This should be quickly resolved on Monday.
Whether SPX reverses now or a couple of days from now should not make that much difference since there are too many good reasons why this is where a correction should start, including the position of the daily indicators (especially the A/D oscillator) which are beginning to turn bearish. When it does correct, the index should break the blue trend line and pull-back at least to the dashed mid-channel line (and most likely beyond). It is not expected, at this time, to come out of its black channel but, when it does, it should indicate that the bull market has come to an end -- which could still happen by the end of the year. Before it does, however, there is a better than even chance that it will make a new high first, unless the correction is far more severe than anticipated.
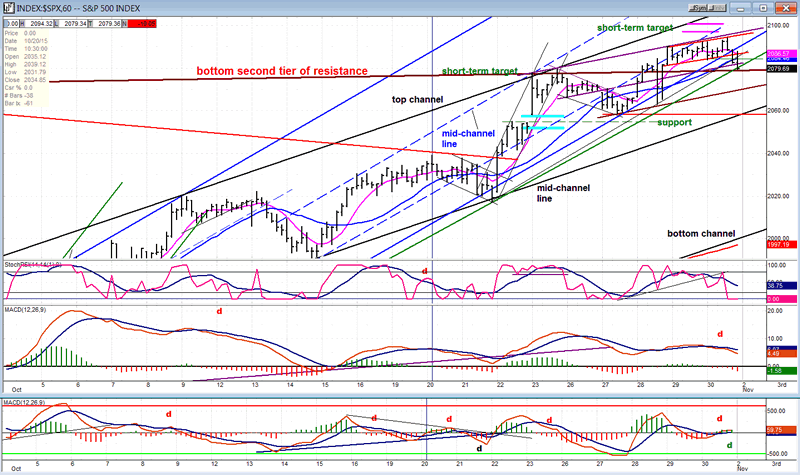
Hourly SPX chart.
The trend has decelerated as the index has been meeting with more and more resistance and it's quite possible that the top actually fell short of the short-term target. As a result, the chart shows the trend shifting from the steeper blue channels to that of the black channel. The correction should not have too much of a problem taking the price down to the black mid-channel line, but if it should go much lower than that, some question will arise as to what kind of a top we have just made.
On Friday, the index closed right on its (green) short-term uptrend line and the momentum indicators have both given a sell signal. But A/D indicators are behaving strangely; first giving the notice of a high with plenty of negative divergence, immediately followed by positive divergence as prices started falling. We'll need to clear that up on Monday.
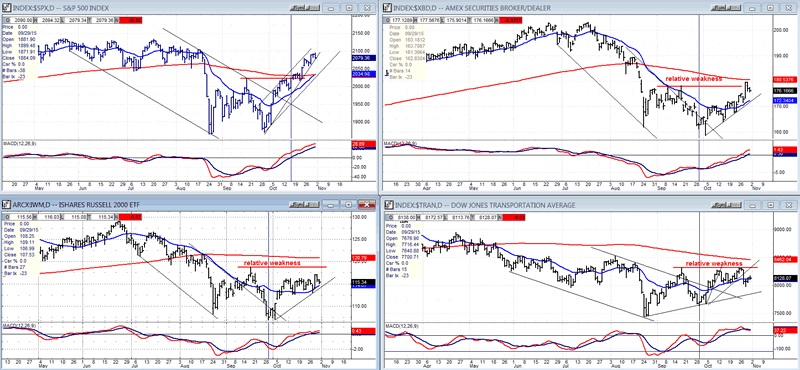
XBD (American Securities Broker/Dealer) and more
The performance of the 3 leading/confirming indexes continues to show relative weakness to SPX. It also appears that TRAN, which led the market down in the last correction, is now the weakest of the three, although not by enough to start drawing some firm conclusions, especially when the QQQ is in the process of challenging its recent high! Since a short-term correction is due, let's wait until it starts so that we can have a better feel about what these indices are trying to tell us.
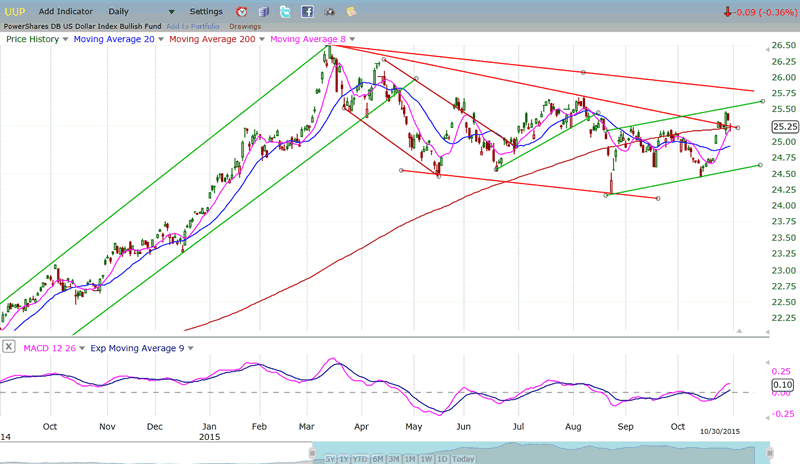
UUP (dollar ETF)
UUP is about to confirm if this is a genuine attempt at resuming its uptrend or another false start. Last week, it briefly broke above its 200-DMA and downtrend line, but pulled back immediately. Next week should be revealing for the short term trend of this index.
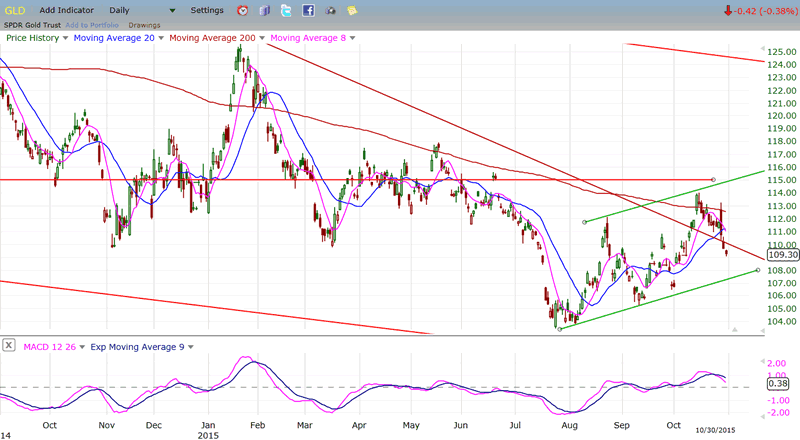
GLD (Gold trust)
GLD has stopped trying to go up and reversed, giving the appearance to the move from its low of being a corrective pattern, likely to precede a decline to a new low. I have repeatedly thought that the index should go and fill its P&F projection to 100 before starting anything substantive. This is beginning to resurface as a real possibility, especially if UUP renews its intermediate uptrend.
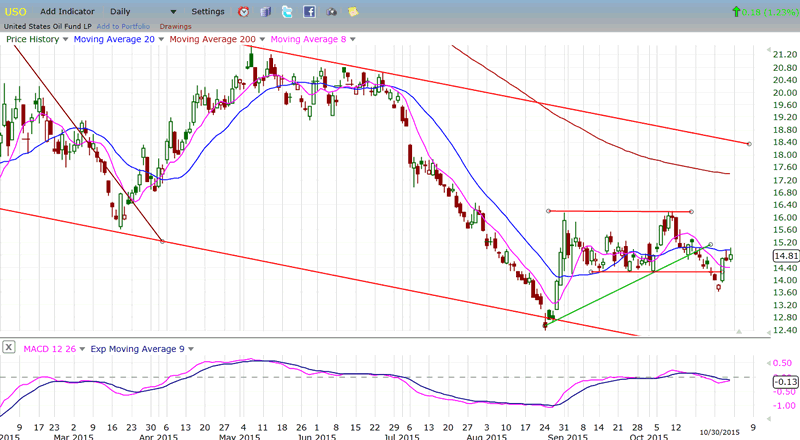
USO (United States Oil Fund
USO broke its short-term support last week, but quickly jumped back above. This is one more index which will require clarification over the next week or so. It appears that we are going through a period of uncertainty.
Summary
Last week, SPX gave plenty of evidence that it was topping, at least on a near-term basis. Since it fell a few points short of its projection for this move, it is not entirely clear if it has failed to reach it, or if it will make another attempt early next week. Friday's action left us in a situation which can be read either way and will require clarification.
Andre
FREE TRIAL SUBSCRIPTION
If precision in market timing for all time framesis something that you find important, you should
Consider taking a trial subscription to my service. It is free, and you will have four weeks to evaluate its worth. It embodies many years of research with the eventual goal of understanding as perfectly as possible how the market functions. I believe that I have achieved this goal.
For a FREE 4-week trial, Send an email to: info@marketurningpoints.com
For further subscription options, payment plans, and for important general information, I encourage
you to visit my website at www.marketurningpoints.com. It contains summaries of my background, my
investment and trading strategies, and my unique method of intra-day communication with
subscribers. I have also started an archive of former newsletters so that you can not only evaluate past performance, but also be aware of the increasing accuracy of forecasts.
Disclaimer - The above comments about the financial markets are based purely on what I consider to be sound technical analysis principles uncompromised by fundamental considerations. They represent my own opinion and are not meant to be construed as trading or investment advice, but are offered as an analytical point of view which might be of interest to those who follow stock market cycles and technical analysis.
Andre Gratian Archive |
© 2005-2022 http://www.MarketOracle.co.uk - The Market Oracle is a FREE Daily Financial Markets Analysis & Forecasting online publication.