


UK Housing Market Transactions Slump to Historic Low
Housing-Market / UK Housing Jul 01, 2008 - 12:15 PM GMTBy: Nationwide

 • House prices fell by 0.9% in June, less than half the rate of the previous month
• Prices are 6.3% lower than this time last year, but remain 4% higher than 2 years ago
• House purchase transactions remain subdued across the UK
• Northern Irish and Scottish activity levels stand out at each extreme
| Headlines | June 2008 | May 2008 |
| Monthly index * Q1 '93 = 100 | 342.3 | 345.5 |
| Monthly change* | -0.9% | -2.5% |
| Annual change | -6.3% | -4.4% |
| Average price | £172,415 | £173,583 |
* seasonally adjusted
Commenting on the figures Fionnuala Earley, Nationwide's Chief Economist, said: ?The pace of house price falls slowed significantly in June. House prices fell by 0.9% during the month, less than half of the rate of the 2.5% fall recorded in May. Prices in June are now 6.3% lower than this time last year and have fallen 7.3% from their peak last October. The price of a typical house is now ?172,415. This is over ?13,500 less than it would have cost at the top of the market and over ?11,500 less than this time last year. However, the strength of house price growth up until last year means that prices are still 4% higher than two years ago and 9% higher than three years ago."
Inflation leads MPC to consider rate hikes
“The last month has been dominated by news on inflation and the economy. The Consumer Price Index measure of inflation exceeded its target by more than one percentage point in May leading to a formal exchange of letters between the Governor of the Bank of England and the Chancellor. It also led to market speculation that the Bank of England would begin to raise interest rates this year. However, the tone of the Governor’s letter to the Chancellor was relatively mild. While recognising the threat inflation poses, the letter suggested that the preference was to allow a slow adjustment to inflation over two years rather than introduce volatility in employment and output in order to return to target within a year.
On the other hand, the minutes did reveal that the option of increasing rates was discussed, although no-one felt strongly enough to vote for it. The MPC is most concerned about inflationary expectations feeding into wage demands. As yet there is little sign of this. The latest data show underlying average earnings growth running at less than 4%. While there are some threats of industrial action, we have yet to see how far this will go, particularly as unemployment is beginning to increase. Nevertheless the MPC will be monitoring this very carefully.
“The adverse inflation developments along with the surprisingly strong retail sales data clearly make it less likely that the Bank of England will be able to rapidly reduce interest rates in response to a slowing economy. But we still think the next move in rates will be down. Our central expectation is that wage growth will remain stable, consumer spending will come under increasing pressure in the coming months and that the economy will continue to slow. If this proves correct, the MPC should feel able to adjust rates before the end of the year.
Volatile markets still affecting mortgage pricing
“While we do not expect an early change in the Bank Rate, the implications of inflationary pressure on funding rates are more stark. The two year swap rate, which is the underlying benchmark for the most popular types of mortgage, (two year fixed rate loans) has increased along with market expectations of increases in bank rates and this has resulted in more frequent mortgage repricing. The tightening of credit conditions over previous months along with changing expectations of house price growth and a general weakening in consumer confidence in the economy have hit mortgage demand and led to a severe slowing in the levels of housing market activity. The latest data from the Bank of England shows house purchase approvals fell sharply in May to 42,000 down from 58,000 the previou month.
Transaction levels are key to house price movements
“The level of transactions is a key driver of house prices. Changes in transaction levels are a good indication of the likely path of prices and across housing cycles have tended to lead changes in house prices by a few months. In the most recent cycle the number of house purchase approvals began to moderate in the first quarter of 2007, whereas annual house price growth did not begin to slow until the third quarter. The number of house purchase approvals per month is now at historic lows and in May was running at less than half of its long run average rate.
![]()
“However the overall level of house purchase approvals masks a number of things. Looking at the mix provides some interesting information. Data on regulated mortgages does not include buy-to-let loans, but interpolating this from CML’s survey data shows that demand for house purchase from all sectors of the market has dropped off this year1, but what is more interesting is which sectors of the market have been most affected.
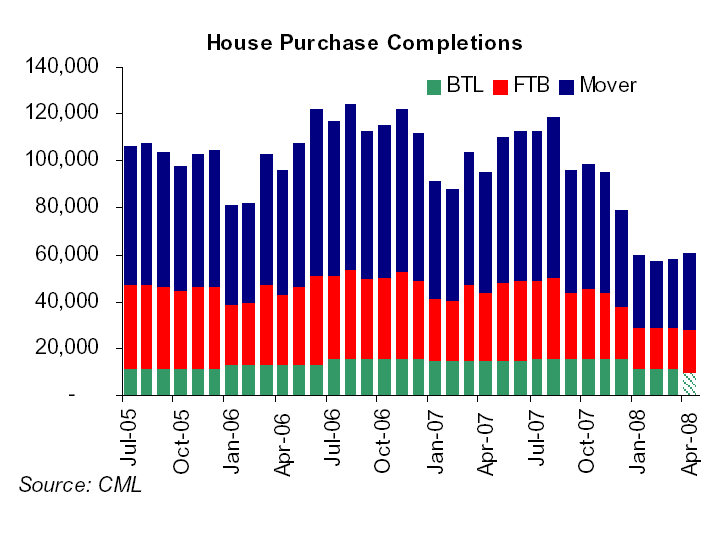
“Perhaps surprisingly given the poor affordability conditions, first-time buyers activity as a proportion of overall house purchase completions has held up fairly well. First-time buyers accounted for about one third of house purchase transactions in the first quarter of the year, exactly in line with the average over the last three years. However, movers’ activity fell back further. Movers accounted for about half of all house purchases in the first quarter, below the 55% average of the last three years. In contrast, estimates of buy-to let house purchase activity held up very well. These purchases accounted for about 19% of house purchase completions in the first quarter – significantly more than the average over the last three years of 14%.
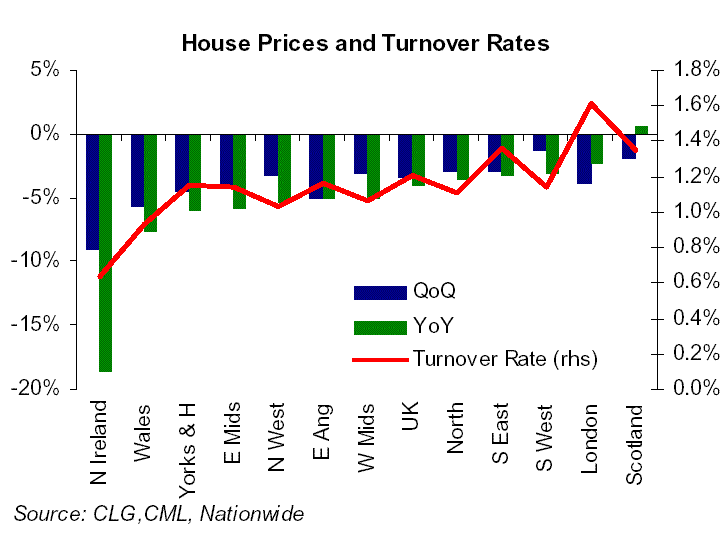
“No regional buy-to-let data activity is available, but the relationship between house prices and regulated house purchase transactions also stands up when looking across the regions. Controlling for the different sizes of the regions by looking at the average turnover rate2 in the last year shows the relationship very clearly. Those regions with the highest turnover generally have had the most resilient house prices.
London and the South East stand out from the trend with relatively higher turnover rates, but this is likely to be a reflection of the greater mobility of the population in these regions. However the comparison between the best and worst performing parts of the UK, Scotland and Northern Ireland, is very stark. Indeed, both of these regions also stand out at the extremes for currently being furthest above and below their average contribution to overall house purchase transactions in the UK over the last three years.
“With house purchase transactions so far below their long term trend it seems unlikely that there will be any rapid turnaround in housing market fortunes in the coming months. However, as prices continue to fall affordability measures become more favourable for those in a well financed position to be able to buy.”
| Fionnuala Earley Chief Economist Tel: 01793 656370 fionnuala.earley@nationwide.co.uk |
Katie Harper Media Relations Manager Tel: 01793 656215 katie.harper@nationwide.co.uk |
Notes: Indices and average prices are produced using Nationwide's updated mix adjusted House Price Methodology which was introduced with effect from the first quarter of 1995. Price indices are seasonally adjusted using the US Bureau of the Census X12 method. Currently the calculations are based on a monthly data series starting from January 1991. Figures are recalculated each month which may result in revisions to historical data. The Nationwide Monthly House Price Index is prepared from information which we believe is collated with care, but no representation is made as to its accuracy or completeness. We reserve the right to vary our methodology and to edit or discontinue the whole or any part of the Index at any time, for regulatory or other reasons. Persons seeking to place reliance on the Index for their own or third party commercial purposes do so entirely at their own risk. All changes are nominal and do not allow for inflation. More information on the house price index methodology along with time series data and archives of housing research can be found at www.nationwide.co.uk/hpi
Nationwide Archive |
© 2005-2022 http://www.MarketOracle.co.uk - The Market Oracle is a FREE Daily Financial Markets Analysis & Forecasting online publication.