Crude Oil Swinging For The Fences - A 20 to 1 Option Play
Commodities / Options & Warrants Nov 23, 2015 - 12:07 PM GMTBy: Bob_Kirtley
 Over the last year oil, and commodities in general, have been much unloved. China and emerging market woes have created demand concerns while a mountain of supply side pressure has also been in play. This has seen oil prices fall from over $100 in early 2014 to hovering just above $40 now at the end of 2015. We believe that the rapid decline and extreme pessimism in the oil market could create a trading opportunity, and that this would be best harnessed by using options.
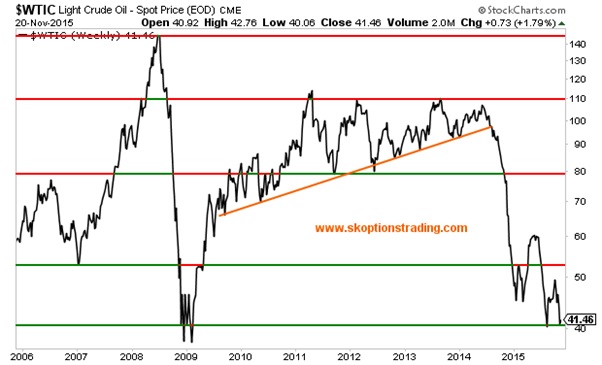
Firstly, we do not claim to be experts on the oil market. This article will not be an in depth discussion of supply and demand dynamics. Although we rarely trade oil directly, we do follow developments closely for their implications in the global macro picture and the other markets that we do directly trade, such as equities, volatility and, gold. However, the risk-reward dynamics at play in long dated call options for oil have brought us close to pulling the trigger on an oil trade for the first time since 2009.
Our bullish view is based on just a few simple observations. Firstly, oil bears are everywhere and bulls are tough to find with nearly all having thrown in the towel over recent months, secondly the ECB is about to embark on more QE that we believe will be supportive of all commodity prices, and finally, there is a real risk of a significant conflict in the middle east which could disrupt supply.
RIP The Oil Bulls
In 2008 as oil was soaring through $100 and even past $140, there were calls left, right, and centre for $200 oil. Now, with oil on the floor there are calls for $20 oil. As mentioned above, we are not oil experts, but we recognize that the oil market has a trait of swinging violently from overly bullish to overly bearish.
Bank analysts are growing still more bearish on oil, predicting that crude prices will remain capped next year as the market struggles to recover from a supply glut. A survey of 13 investment banks by The Wall Street Journal showed that the average forecast is for West Texas Intermediate is $54.40 by the end of next year. Whilst higher than current spot, it is only 12% higher than where the December 2016 futures contract closed on Friday ($48.85).
It is very tough to find anyone calling for a return to $70+ prices, let alone the $100+ highs. We take this as an encouraging sign since we are looking for a contrarian trade with a high payoff and low probability of success, but positive risk-reward dynamics.
Inflation Targeting QE
While the Fed is looking at increasing rates next month, across the Atlantic it is becoming more apparent that the ECB will increase its QE program in an attempt to stimulate inflation.
Draghi said at his speech in Frankfurt last week; "We will do what we must to raise inflation as quickly as possible. That is what our price stability mandate requires of us." The ECB has an inflation target of 2%, but prices in the Eurozone have continuously stayed low, with the annual CPI at 0.1% in October.
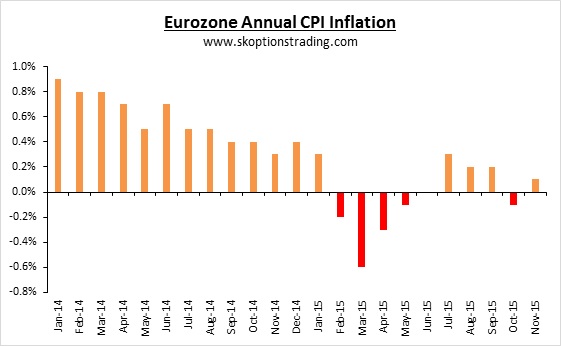
Commodity prices are a major component of inflation, with energy prices having knock-on effects throughout all products and services. Earlier this year the disinflationary impact from lower oil prices arguably was a major contributor to the Federal Reserve’s decision to delay any rate hikes until year end. The ECB is growing increasingly frustrated with the lack of inflation, and therefore will likely upscale and upgrade their QE program next month.
If oil and other commodity prices fall further, this will eliminate the chances of any uptick in inflation. Therefore such a decline is likely to lead to yet more QE from Draghi until some pick-up in inflation is achieved. There is a chance that the market catches on to this theme, and that oil and other commodity prices begin to head higher next year as the ECB’s inflation targeted QE sees demand increase across the board.
In short, QE is targeting inflation, and inflation needs higher oil prices.
Geopolitical Risks
The risk of a severe supply disruption in the Middle East is very real and in our view quite asymmetric. Although there is increased supply coming from Iran, this is largely priced into the market and now all but fully expected by market participants. Elsewhere there is a risk that a conflict, as a result of the recent tragic events in Paris, could severely impact some OPEC suppliers.
The region is unstable and crucially it is from this very region that the mass increase in supply has come from. Even if the supply is not disrupted, the threat of disruption adds to the risk of a spike higher in oil prices.
Risk Reward
Taking it to a practical level is where we believe the rational for a trade becomes most apparent. The Oil ETF USO is what we will use to demonstrate the type of trade we are considering. The following chart roughly equates USO to crude oil prices, will a few approximate translations. Note these are not exact due to a number of factors including ETF fees, the shape of the oil futures curve and other factors.
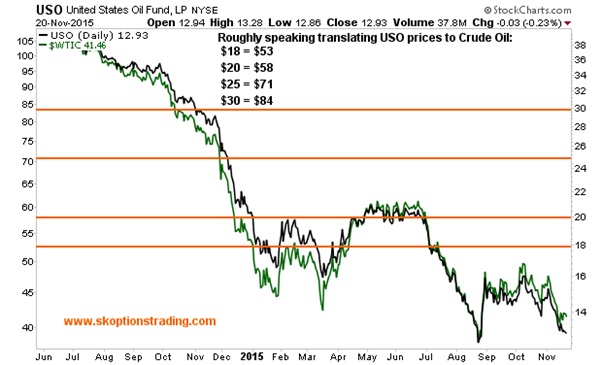
We are looking at long dated, far out of the money calls, and speculating that $70 oil isn’t as unlikely as most people think.
At the most basic level, the Jan-2017 $18 strike call options are priced at $0.67, and the $20 strikes are priced at $0.47. If USO could return to $25 (roughly equivalent to crude at over $70) at or before expiration, then those calls would be worth $7 and $5 respectively, or a respective return of 945% or 964%.
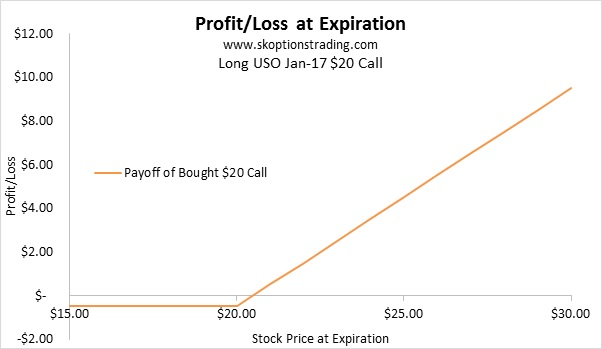
Taking it a touch further, using vertical call spreads makes the risk-reward dynamics easier to define. This strategy involves buying a call option and simultaneously selling another call option with the same expiration date at a higher strike. This limits the potential return of the trade but reduces the entry cost. Both strategies are limited risk.
For example we look at buying the Jan-17 $20 call and selling the Jan-17 $25 call. On a net basis this costs us $0.25 and the maximum the trade could be worth is $5, the difference between the strike prices. If USO was at or above $25 upon expiration the trade would return 2000%. This is our favoured 20-1, swing for the fence, trade.
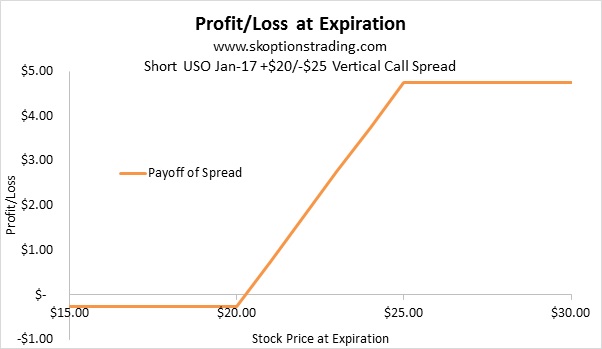
We note that one could extend expiration and execute the same trade with Jan-18 expiry for $0.43. Although this costs 65% more in premium terms, it does buy nearly double the time available. However, we caution that at present liquidity in the Jan-18 USO options is not great and some investors may struggle to execute their desired size.
How hard to swing?
When one swings for the fence, the most likely scenario is that one misses completely. Thus we acknowledge that the most likely scenario for this trade is that we lose our entire premium. The chances of this trade being profitable are slim and the probability of a loss is high. However on a risk reward basis we think the trade has merit, if only for a small amount of one’s capital.
Initially our inclination is risking something like 5% of our portfolio over two years. We favour the USO Jan-17 +$20/-$25 Vertical Call Spread around $0.25, and would look at rolling this position to Jan-18 when liquidity improves in that expiry. A loss of 2.5% per year is tolerable in our view when the payoff is that one's portfolio value could double.
In conclusion we are not experts on oil, or regular traders of this market. However, our speciality is identifying trades with positive risk-reward dynamics and this is one that ticks the boxes. The chances of success are very low and the chance of a loss very high, hence our extreme caution with the quantity of capital allocated to this trade. Nevertheless the payoff, if this contrarian trade proves right, is enough to justify a capital allocation in our view. To see if we pull the trigger on this trade, and what other trades our capital is allocated to, please subscribe via either of the buttons below.
Go gently.
Bob Kirtley
Email:bob@gold-prices.biz
URL: www.silver-prices.net
URL: www.skoptionstrading.com
To stay updated on our market commentary, which gold stocks we are buying and why, please subscribe to The Gold Prices Newsletter, completely FREE of charge. Simply click here and enter your email address. Winners of the GoldDrivers Stock Picking Competition 200
DISCLAIMER : Gold Prices makes no guarantee or warranty on the accuracy or completeness of the data provided on this site. Nothing contained herein is intended or shall be deemed to be investment advice, implied or otherwise. This website represents our views and nothing more than that. Always consult your registered advisor to assist you with your investments. We accept no liability for any loss arising from the use of the data contained on this website. We may or may not hold a position in these securities at any given time and reserve the right to buy and sell as we think fit.
Bob Kirtley Archive |
© 2005-2022 http://www.MarketOracle.co.uk - The Market Oracle is a FREE Daily Financial Markets Analysis & Forecasting online publication.


