


Stock Market Primary V Inflection Point
Stock-Markets / Stock Markets 2015 Dec 05, 2015 - 02:06 PM GMTBy: Tony_Caldaro

 A wild week! The market started off the week at SPX 2090. After a tick up to SPX 2094 Monday morning the market pulled back to 2080 by the close. Tuesday we had a gap up to SPX 2099, a drop to 2087, then a rally to end the day at 2103. Wednesday the market ticked up to SPX 2104, then started to sell off. On Thursday the selloff hit a low of SPX 2042, and then the market rallied into a Friday high of 2094 before ending the week at 2092. For the week the SPX/DOW were +0.20%, the NDX/NAZ were +0.55%, and the DJ World index was down 0.40%. Economic reports for the week were mostly negative. On the uptick: construction spending, factory orders, the WLEI and the ADP. On the downtick: the Chicago PMI, ISM manufacturing/services, monthly payrolls, the GNP, plus the trade deficit and weekly jobless claims rose. Next week will be highlighted by Retail sales, Export/Import prices and the PPI.
LONG TERM: bull market
With the market entering gyration mode this week, four months into the current uptrend, it has reached another inflection point. The bull market remains intact for at least the next several weeks, at minimum, to possibly well into next year. Suggest reviewing the weekend updates, at least until this inflection point resolves itself.
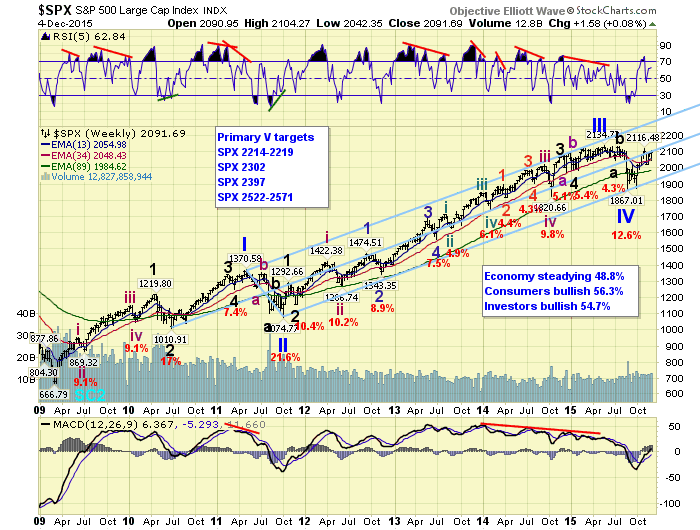
This Cycle wave [1] bull market continues to unfold in five primary waves. Primary waves I and II completed in 2011. Primary waves III and IV completed this year in 2015. Primary V is currently underway from the August SPX 1867 low. When Primary V ends so will this 6+ year bull market. Historically when Cycle wave bear markets unfold, Cycle [2] should follow, the market has lost between 45% and 50% of its value. As a result the market is gradually reaching an important turning point. We will do our best to identify the turn when it arrives.
MEDIUM TERM: uptrend at inflection point
The uptrend from the Primary IV SPX 1867 low was unfolding as expected until it ran into some price turbulence this week. We had labeled four of the five waves at these levels, with the fifth wave underway SPX: 1993-1872-2116-2019-xxxx. This labeling still looks correct. Since there was the possibility that this uptrend could be the last uptrend of the bull market, we labeled these four waves as Major waves 1-2-3-4 with the 5th underway. This may still be correct.
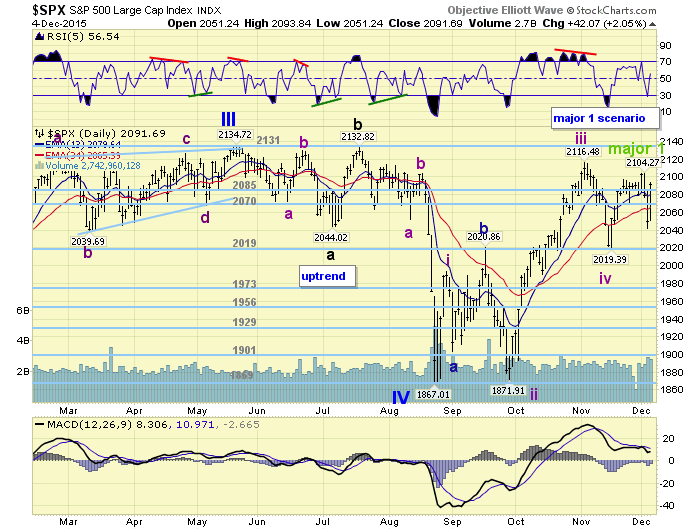
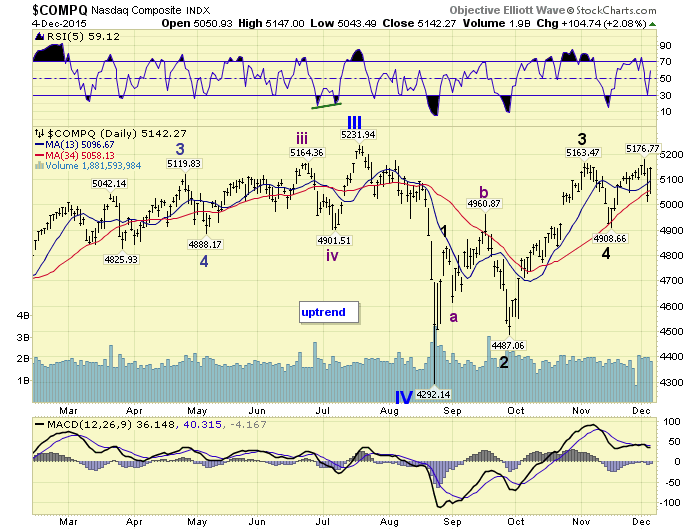
At Wednesday’s high the SPX hit 2104, short of its third wave high at 2116, and well short of its bull market high at 2135. Then the SPX experienced its largest decline since the two big pullbacks of Major waves 2 and 4. With the NDX/NAZ reaching higher uptrend highs on Wednesday, this decline suggested a possible fifth wave failure in the SPX/DOW to end the uptrend. If this does actually occur, an unconfirmed downtrend is currently underway. This would also suggest that the bull market would extend well into 2016. So a downtrend at this stage of the bull market is not good medium term, but quite good longer term.
The other possibility is that the recent high at SPX 2104 was only Intermediate wave one of Major wave 5. This would suggest that Major wave 5 is subdividing, just like Major wave 3, and the bull market will probably end in the next several weeks if this uptrend makes all time new highs. Quite an interesting situation for bulls and bears alike. The key for anticipating which scenario will unfold appears to be the OEW 2070 pivot range (2063-2077). If the market can hold this pivot range, as it was recaptured on Friday, the uptrend will extend to higher highs. If not, a downtrend is likely underway with support at the 2019 pivot, SPX 1992, and the 1956 pivot. Medium term support is at the 2085 and 2070 pivots, with resistance at the 2131 and 2145 pivots.
SHORT TERM
The recent rally from our Major 4 low at SPX 2019 was unfolding as expected. We had four waves up SPX: 2067-2046-2097-2080 into last week with another rally underway. We had labeled these four waves as: i-ii-1-2. This week, however, the market opened at SPX 2094, dipped to 2080, rallied to 2099, dipped to 2087, rallied to 2104, then had that steep selloff. Our screening of the short term price movement missed that 2099-2087 pullback, or else we would have noticed the short term diagonal triangle that had formed. However, on the price movement we knew a drop below SPX 2080 was a warning, and a drop below SPX 2070 would not be good short term. Since the sharp three wave selloff (2067-2078-2042) did look like the result of a diagonal triangle or a fifth wave failure this appears to fit.
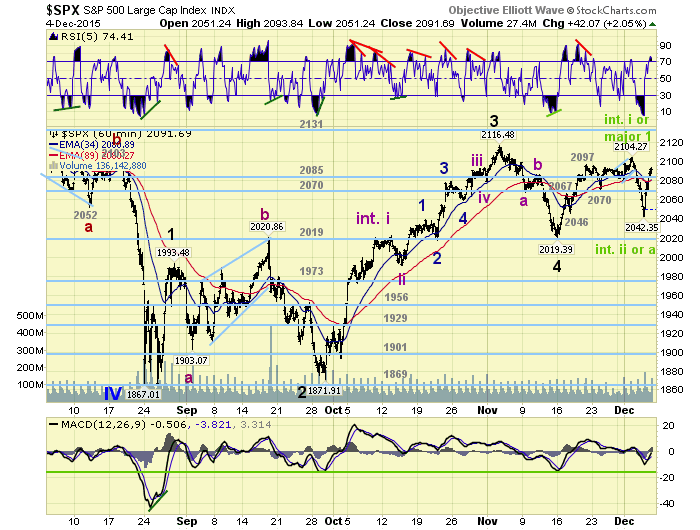
After the selloff hit a low around 2:30 Thursday the market rallied a bit, gapped up on Friday and rallied quite strongly. This presents us with two possible counts and the reason for the inflection point. One: a fifth wave failure at SPX 2104 and a new downtrend underway. Two: an Intermediate wave one of Major wave 5 at SPX 2104, with an Intermediate wave two at SPX 2042. Should scenario one unfold the bull market will probably extend well into next year, as this uptrend would only be Major wave 1 of Primary V. Should scenario two unfold, and the market makes all time new highs, which is likely, then the bull market will probably end in the next several weeks. Short term support is at the 2085 and 2070 pivots, with resistance at the SPX 2104 and SPX 2116. Short term momentum hit extremely oversold on Thursday and spiked to overbought on Friday.
FOREIGN MARKETS
Asian markets were mostly lower on the week for a net loss of 0.5%.
European markets were all lower for a net loss of 3.7%.
The Commodity equity group were all lower losing 1.5% on the week.
The DJ World index is still in an uptrend but lost 0.4% on the week.
COMMODITIES
Bonds continue to uptrend but lost 0.4% on the week.
Crude is still in a downtrend and lost 4.3% on the week.
Gold looks like it may be uptrending and gained 2.7% on the week.
The USD looks like it is downtrending and lost 1.7% on the week.
NEXT WEEK
Monday: Consumer credit at 3pm. Wednesday: Wholesale inventories. Thursday: weekly Jobless claims, Export/Import prices, and the Budget deficit. Friday: the PPI, Retail sales, Business inventories, and Consumer sentiment. Best to your weekend and week!
CHARTS: http://stockcharts.com/public/1269446/tenpp
After about 40 years of investing in the markets one learns that the markets are constantly changing, not only in price, but in what drives the markets. In the 1960s, the Nifty Fifty were the leaders of the stock market. In the 1970s, stock selection using Technical Analysis was important, as the market stayed with a trading range for the entire decade. In the 1980s, the market finally broke out of it doldrums, as the DOW broke through 1100 in 1982, and launched the greatest bull market on record.
Sharing is an important aspect of a life. Over 100 people have joined our group, from all walks of life, covering twenty three countries across the globe. It's been the most fun I have ever had in the market. Sharing uncommon knowledge, with investors. In hope of aiding them in finding their financial independence.
Copyright © 2015 Tony Caldaro - All Rights Reserved Disclaimer: The above is a matter of opinion provided for general information purposes only and is not intended as investment advice. Information and analysis above are derived from sources and utilising methods believed to be reliable, but we cannot accept responsibility for any losses you may incur as a result of this analysis. Individuals should consult with their personal financial advisors.
Tony Caldaro Archive |
© 2005-2022 http://www.MarketOracle.co.uk - The Market Oracle is a FREE Daily Financial Markets Analysis & Forecasting online publication.