


Silver Rides Along with Gold Price Breakout
Commodities / Gold and Silver 2015 Dec 07, 2015 - 12:10 PM GMTBy: Clive_Maund

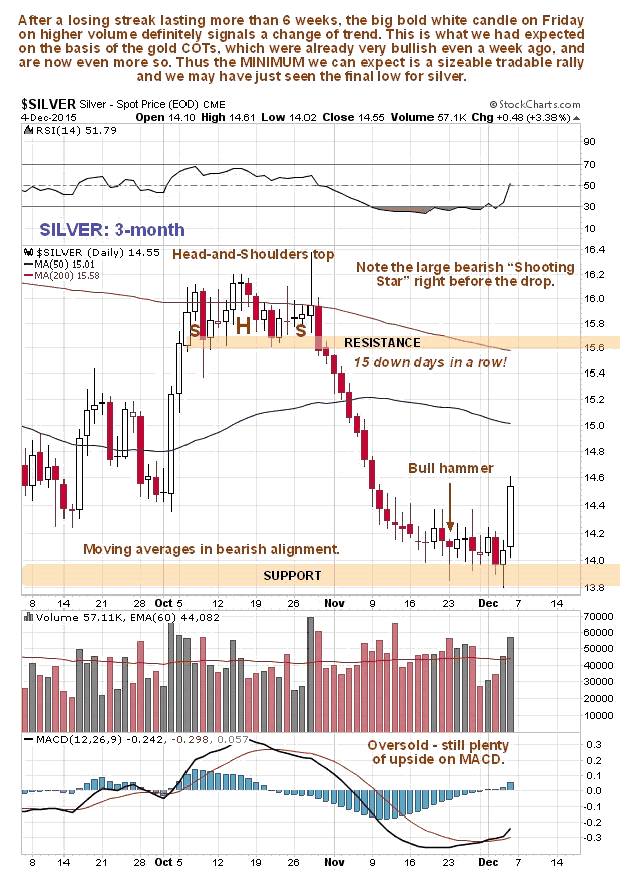
 Silver broke out with gold on Friday, following an extraordinary plunge in the dollar on Thursday. On its 3-month chart we can see that the ground had been well prepared for this move, with an intermediate base pattern having formed above support for about 3 weeks prior to the breakout. The preceding persistent decline included an extraordinary 15 days down in a row. There were various indications of an impending upside breakout, including the appearance of a bull hammer at the support and a bullish cross by the MACD indicator above its moving average, the large gap with moving averages, and, in the background, silver's COT was improving and gold's COT had become remarkably bullish by last week.
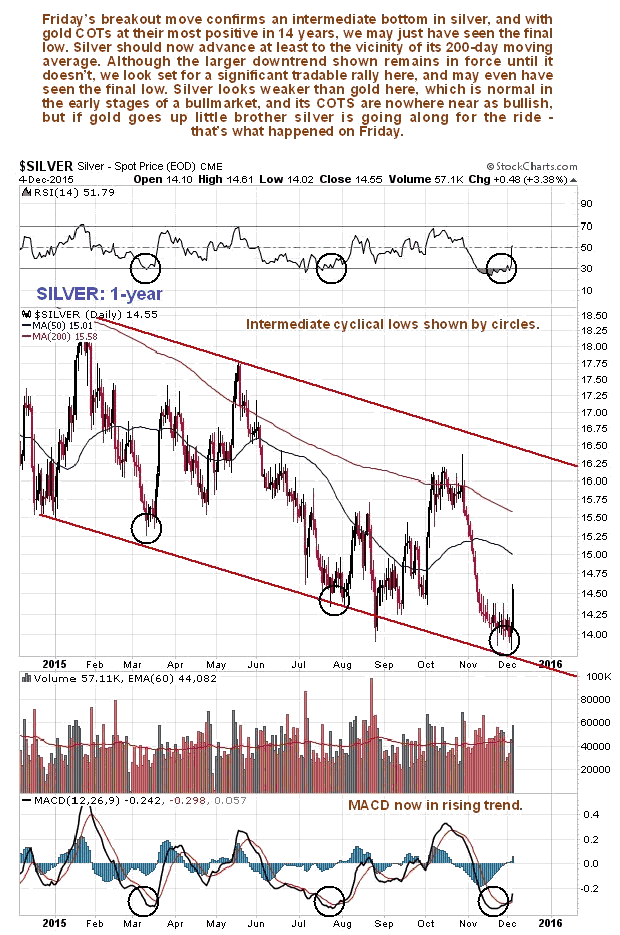
On its 1-year chart we can see that silver was at a good point to turn up as it had dropped to a cyclical low at the bottom of the downtrend channel shown, and was about as oversold as it was on 2 previous occasions shown by the circles, which were followed by recovery rallies. It now looks like silver will traverse back across the channel at least to its 200-day moving average and possibly to the upper boundary of the channel. If it succeeds in breaking above that it will be an important bullish development, but the current unfavorable alignment of moving averages may prevent that at least for a while. Even if it only makes it back as far as the 200-day moving average, it will be a good tradable move, especially for leveraged ETFs and options.
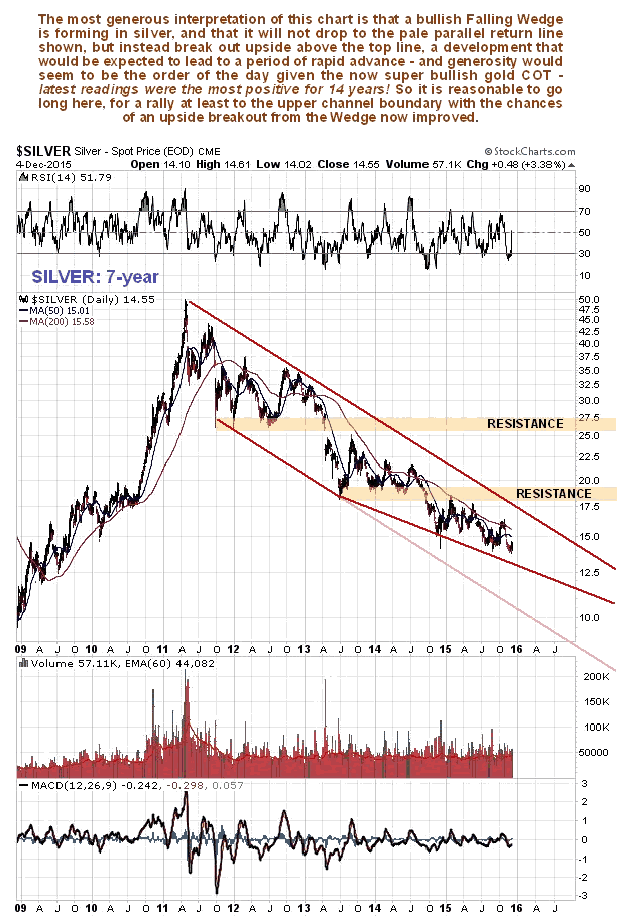
Silver's long-term 7-year chart still looks rough, with it still being in a bearmarket. However, the major downtrend channel is converging noticeably, so it may be that a bullish Falling Wedge is developing, which is made more likely by the fact that there is strong convergence in gold's downtrend channel and gold's COT is now more positive than at any time in the past 14 years. We will be able to assess the chances of silver breaking out of this downtrend channel (and the inner channel shown on the 1-year chart above) later by observing what happens to Commercial short positions as the price approaches them. This will help us to determine whether to take profits on long positions and perhaps reverse to short again.
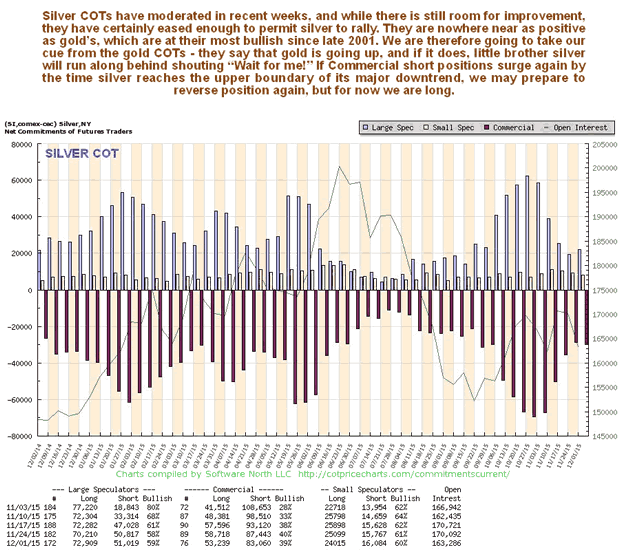
Silver latest COTs are modestly bullish - nowhere near as bullish as gold's - but if gold advances, as it is expected to, then silver is "going along for the ride" and will advance too, just like it did on Friday.
By Clive Maund
CliveMaund.com
For billing & subscription questions: subscriptions@clivemaund.com
© 2015 Clive Maund - The above represents the opinion and analysis of Mr. Maund, based on data available to him, at the time of writing. Mr. Maunds opinions are his own, and are not a recommendation or an offer to buy or sell securities. No responsibility can be accepted for losses that may result as a consequence of trading on the basis of this analysis.
Mr. Maund is an independent analyst who receives no compensation of any kind from any groups, individuals or corporations mentioned in his reports. As trading and investing in any financial markets may involve serious risk of loss, Mr. Maund recommends that you consult with a qualified investment advisor, one licensed by appropriate regulatory agencies in your legal jurisdiction and do your own due diligence and research when making any kind of a transaction with financial ramifications.
Clive Maund Archive |
© 2005-2022 http://www.MarketOracle.co.uk - The Market Oracle is a FREE Daily Financial Markets Analysis & Forecasting online publication.