


History Shows that Gold Has Been In Worse Situations Before, But Still Managed to Recover
Commodities / Gold and Silver 2015 Dec 17, 2015 - 04:19 PM GMTBy: Nicholas_Kitonyi

 Gold has always been seen as one of the best when it comes to investments. Unlike other forms of investments, the price of gold does not rely on certain aspects that are guaranteed to change at some point in time like company management or competition.
This is what makes the yellow metal a haven for most investors during tough economic times. On the contrary, when economies are doing well, and particularly the US economy, gold does seem to struggle a bit due to its links with the US dollar.
The price of gold has been characterized by a series of lower highs and lower lows over the last 20 months or so, and before that period, it was a landslide decline following its peak high of about $1,956 back in 2011.
Currently, the price of the yellow metal appears set for another rebound, which could take it above $1,100 if investors buy into the Bull Run story.
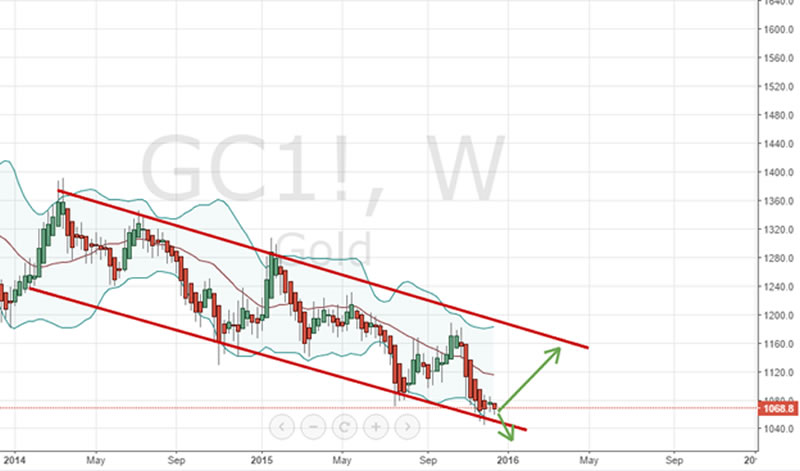
With the current price pegged at about $1,058, there could be a significant upside by early next year as the effects of the US Federal Reserve interest rate hike wear out while at the same time uncertainty grows over the potential impact on US economy. The performance of the price of gold over the last few quarters illustrated the kind of suspense the market was in as people waited for the Federal Reserve to increase interest rate. The same situation along with other factors has affected the price of crude oil with the USD maintaining its rally against major currencies and commodities.
Gold is not losing its brand as a store of value
A country’s currency relies much on the economic performance. The US dollar has been on a rally since late 2013, which also marked the start of the massive decline in gold price. On the other hand, Crude Oil had been on a major decline dating back to mid-2012 and the consequential strengthening of the USD did not help the situation.
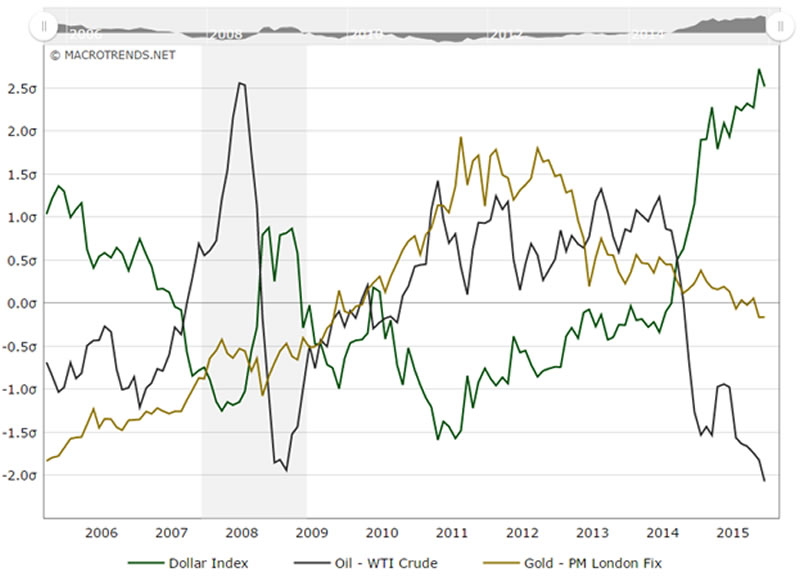
Gold price versus Crude Oil versus USD performance 10-years
At the beginning of 2014, the performance of the USD crossed over the performances of both the price of gold and crude oil and since then, the green back has remained bullish while gold and oil continue to move south.
Nonetheless, investors should borrow a leaf from the behavior of the three investment vehicles back in the year 2007 just before the start of the global financial crises. There was a similar cross over which was shortly followed by a recovery in the price of gold while the USD nosedived to negative territory performance wise as depicted in the chart above.
At the moment, it is hard to rule out a similar occurrence especially given the fact that a majority of the world’s leading economies are still struggling. When you look at China, Japan, the UK, Russia and the rest of the members of the Eurozone, it is easy to say that in terms of economic recovery, the world as a whole is not off the hook yet.
The last few years have demonstrated some stability thanks to a series of quantitative easing programs initiated by the EU, the US and leading Asian economies. However, with the US having ended its QE program a little over a year ago and increasing interest rates, there are question marks about possible consequences of raising interest rates prematurely. Inflation is still at 0.25% while wages remain low.
This is why I believe that the price of gold could be due a major rebound in the coming quarters as investors move to hedge their savings or investments with positions in gold. Whether they are going to buy gold bullion or simply trade long the yellow metal via various derivative platforms, signs are that gold will yet again demonstrate its ability to rebound from adverse situation thereby maintaining its brand as the best store of value.
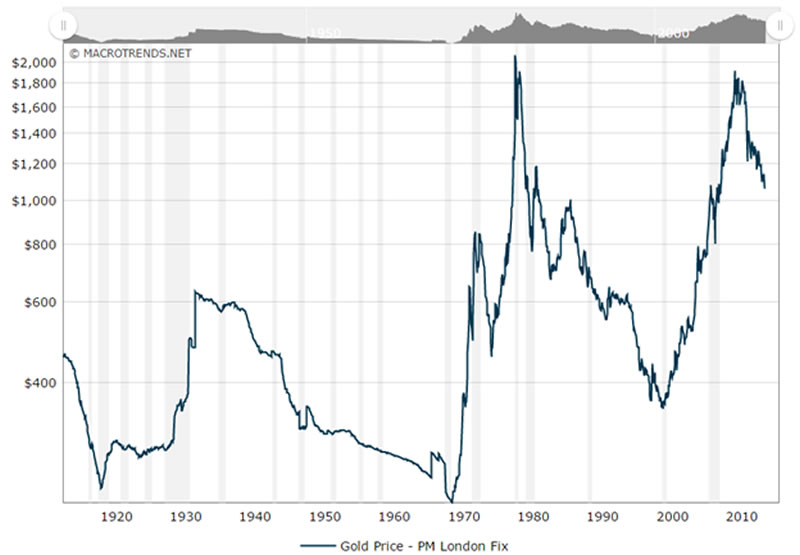
Gold price 100-year inflation adjusted chart
In fact, the current situation is not any worse than what happened between 1980 and the year 2000. As illustrated in the inflation adjusted chart above, the price of gold managed to recover from its worst plunge in recent history bouncing from the inflation adjusted price of about $360 an ounce in the year 2000 to about $1,926 an ounce in 2011. Notably, the price of gold reached an all-time inflation adjusted high of about $2,073 in 1980. We are still way below those levels signaling gold bull market is far from over.
Given the performance demonstrated by the price of the yellow metal in recent history, there is no guarantee that investors should expect an immediate recovery. There have been worse situations in the past, which means that the price of gold could still fall further, but again the recoveries in the past mean that we can still expect the yellow metal to hit the top again.
Conclusion
The bottom line is that gold has demonstrated through history that its purchasing power is far more superior compared to other currencies simply by the virtue of the fact that the yellow metal is used to determine the value of various currencies.
Early this year, Switzerland’s National Bank SNB unpegged the maximum appreciation possible against the Euro in a move that saw bullish EUR/CHF investors lose money momentarily. Prior to that (in November last year), the Swiss nationals had just voted against a referendum that would have seen the Swiss Central bank acquire more gold.
Note that National central banks hold gold reserves as a guarantee to redeem promises to pay depositors and note holders (such as paper money), or to secure a currency. An increase in gold reserves often results in the devaluation of a currency. Investors should have read the signs early after the rejection of the move that could have resulted in a devaluation of the CHF.
Nonetheless, this also illustrates why gold remains to be a critical part of every currency thus making it the best store of value.
By Nicholas Kitonyi
Copyright © 2015 Nicholas Kitonyi - All Rights Reserved Disclaimer: The above is a matter of opinion provided for general information purposes only and is not intended as investment advice. Information and analysis above are derived from sources and utilising methods believed to be reliable, but we cannot accept responsibility for any losses you may incur as a result of this analysis. Individuals should consult with their personal financial advisors.
© 2005-2022 http://www.MarketOracle.co.uk - The Market Oracle is a FREE Daily Financial Markets Analysis & Forecasting online publication.