


Sugar Commodity Trade Setup
Commodities / Agricultural Commodities Dec 18, 2015 - 04:55 AM GMTBy: Chris_Vermeulen

 Before I dig into the nitty gritty of this potentially sweet trade setup, I would like to first wish everyone a Merry Christmas and Happy Holiday!
Being from Canada, I’m very lucky to be able to spend quality time with my family for the next month down in the sunshine state of Florida. I sure love the ocean breeze, sand between the toes, palm trees, and heat. Its amazing how cold Floridians make a sunny 70-degree day look being all bundled up in pants, jackets, and hats while I live in my bathing suit practically the entire time I’m down here. I don’t put on pants or a sweater until its 65ish outside or a restaurant demands I must wear pants and I’m still sweating wearing all that clothing. Its great to be back in America!
Ok, lets get back to this sweet trade setting up!
In this article, I show you my analysis and share my thoughts on what is likely to take place with sugar looking forward 2-3 months if not longer. Instead of writing a long article I have attached three charts which clearly show my thinking and price projections.
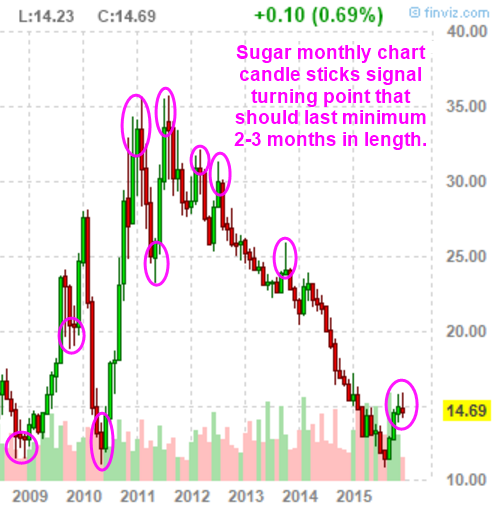
MONTHLY CHART OF SUGAR
The monthly chart moves as slow as molasses for trading and investing, but it does provide valuable information. The key data it shows us are the major trend, support and resistance levels, and potential reversal signals via candlestick patterns.
Typically, if a chart shows a long lower or upper wick it signals price has found either support or resistance and a change in direction is likely to occur.
The chart below is currently showing up what I call “Tweezers”. Two candles both with long upper wicks which tell us seller are present and selling into the buying pressure. This is a great signal that lower prices are very possible. You should keep in mind that we are only half way through the month of December which means this candle still has another 10+ days of trading before it closes. So this is not a true tweeze pattern until the month is over.
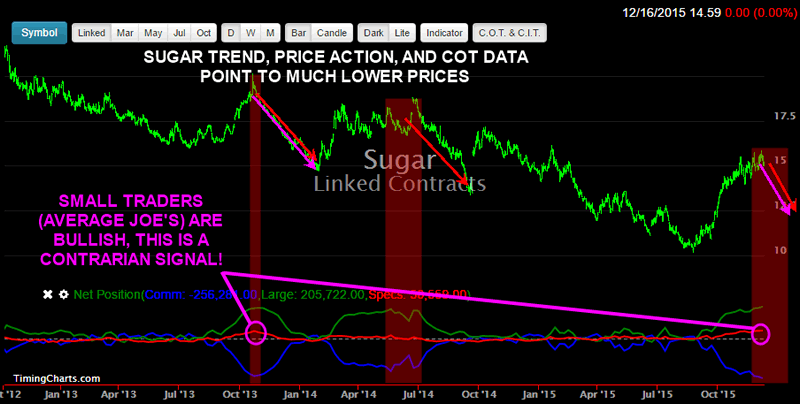
DAILY CHART OF SUGAR & COT DATA
This chart below shows some very interesting data which one of my subscribers pointed out a couple weeks ago. I have been watching the price of sugar waiting for a potential setup to form and it looks as though the time has come which I will show in more detail later in this article.
What I like most about this information is the COT data. Specifically, the spec traders position which show the average joe/gamblers are all very bullish trying to get their sugar fix J.
Typically, the small spec positions are based on emotions and when everyone is doing something, people don’t like to be left behind so they follow the herd mentality, BUY BUY BUY!
As you can see in the recent trading the price of sugar has been chopping around with increased volatility, which tells me sellers are entering the market.
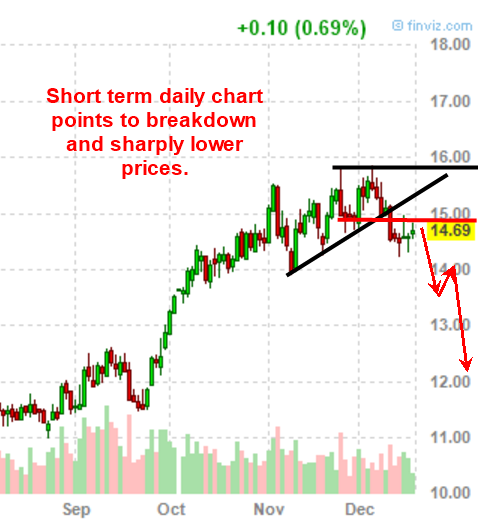
DAILY CHART OF SUGAR TRADE SETUP
Below I have laid out visually the key resistance levels for sugar. Ideally, the sooner price breaks down the lower price are likely to fall as it will have strong momentum. If price lingers and moves above the $15 level for several days, then it won’t be as bearish of a setup in my opinion.
The breakdown that I have drawn on the chart with red arrows shows the best case scenario. Unfortunately, there is not an inverse EFT for sugar. For one to profit from falling sugar you will need to short sell the sugar ETF SGG.
I should mention that earlier this week I sent out a great trading opportunity that would allow you to easily trade indexes, all commodities, currencies and even the most popular 50 stocks using what I use. Its commission free trading, you can trade 24 hours a day, and place any position size you want as little as $15 on sugar or the SP500 index. It’s the ultimate way to learn to trade while trading live without losing a ton of money. And to sweeten the deal, if you use my special link here you can get free trading cash to start! Special Trading Opportunity: CLICK HERE
SUGAR TRADE SETUP CONCLUSION:
In short, I think sugar is/has setup for a short trade and will fall over the coming months. Nothing in the financial market is for certain, but I do like this trade setup for a small speculative position.
Stay tuned for more trading ideas as I have a great Holiday Gift Idea and Trade that I will share in a few days… So get on my email list, or join my premium trade alert newsletter and get all my trades, analysis and educational videos so you can master the markets and profit for life!
Visit : www.TheGoldAndOilGuy.com
Chris Vermeulen
Join my email list FREE and get my next article which I will show you about a major opportunity in bonds and a rate spike – www.GoldAndOilGuy.com
Chris Vermeulen is Founder of the popular trading site TheGoldAndOilGuy.com. There he shares his highly successful, low-risk trading method. For 7 years Chris has been a leader in teaching others to skillfully trade in gold, oil, and silver in both bull and bear markets. Subscribers to his service depend on Chris' uniquely consistent investment opportunities that carry exceptionally low risk and high return.
Disclaimer: Nothing in this report should be construed as a solicitation to buy or sell any securities mentioned. Technical Traders Ltd., its owners and the author of this report are not registered broker-dealers or financial advisors. Before investing in any securities, you should consult with your financial advisor and a registered broker-dealer. Never make an investment based solely on what you read in an online or printed report, including this report, especially if the investment involves a small, thinly-traded company that isn’t well known. Technical Traders Ltd. and the author of this report has been paid by Cardiff Energy Corp. In addition, the author owns shares of Cardiff Energy Corp. and would also benefit from volume and price appreciation of its stock. The information provided here within should not be construed as a financial analysis but rather as an advertisement. The author’s views and opinions regarding the companies featured in reports are his own views and are based on information that he has researched independently and has received, which the author assumes to be reliable. Technical Traders Ltd. and the author of this report do not guarantee the accuracy, completeness, or usefulness of any content of this report, nor its fitness for any particular purpose. Lastly, the author does not guarantee that any of the companies mentioned in the reports will perform as expected, and any comparisons made to other companies may not be valid or come into effect.
Chris Vermeulen Archive |
© 2005-2022 http://www.MarketOracle.co.uk - The Market Oracle is a FREE Daily Financial Markets Analysis & Forecasting online publication.