US Stock Market & the Gold Sector Analysis
Commodities / Gold and Silver Stocks 2016 Jan 29, 2016 - 12:24 PM GMTBy: Gary_Tanashian
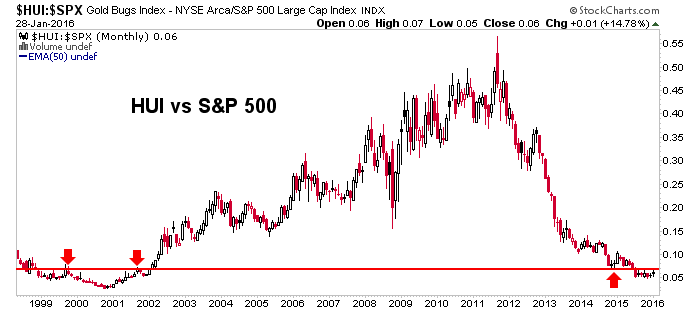
 To review our stance, which is years along now, the gold sector is not going anywhere until it becomes widely accepted that developed stock markets, including and especially those in the US, are in bear cycles. We have also drawn analogies to the Q4 2008 event that took place in what felt like a nanosecond compared to today’s long, drawn out process. For this reason, a better ‘comp’ has been the 1999 to 2001 time frame. That was a process as well.
Regardless, gold boosters viewing inflation as the reason to buy the sector are still out there pitching, but even they have retooled their pitches for a deflationary world. It is now and always has been a global economic contraction environment (assuming it eventually coerces policy makers into inflationary actions) that would be the primary driver of the next gold bull market. Say, whatever happened to all the stories about China demand, a China/India love trade, supply/demand capers on the COMEX and ‘US jobs to spur inflation driving big, smart institutional money into gold’ anyway?
What happened to them is that they were debunked as having little to no bearing on the price of gold and thus, gold’s bear market. Incidentally, here is a gold-focused analyst who is a sound source of information amid the cacophony of opinions that have mostly led people astray post-2011.
You may recall the cool graphic from the first of our Macrocosm series posted in July. What is the largest planet you see, eh Beuller? What is the second largest? Anyone?
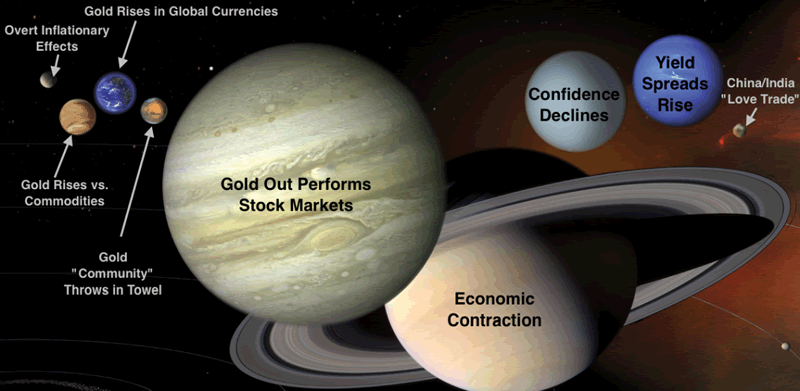
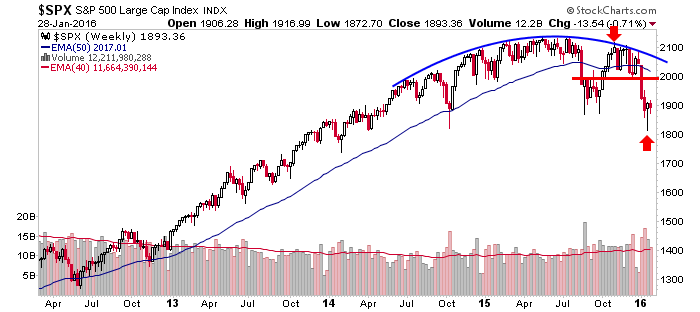
After successfully managing the post-July process of stock market momentum loss, drop, bounce, double bottom and then rally hard (based on hysterically over bearish sentiment), and finally grinding into year-end we projected resumed bearishness, at which point it was time to gauge a new bear trend. While other indexes like those in the second chart below established bear trends ahead of time, we awaited the grand Poo bah, the S&P 500 to turn its intermediate trend negative.
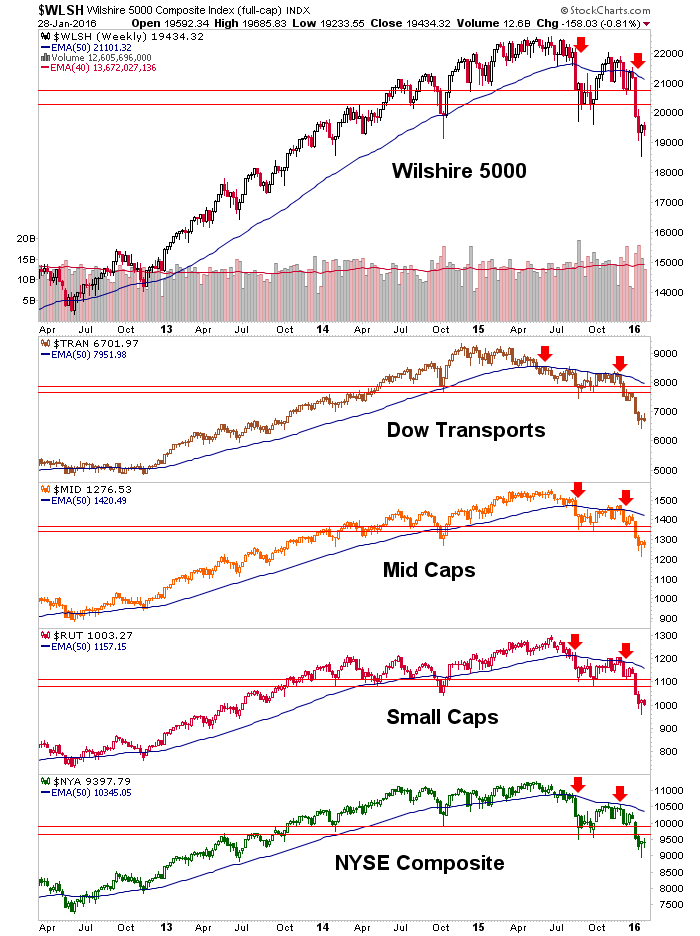
In October SPX bounced hard to challenge all-time highs above the weekly EMA 50, while the broad WLSH was somewhat weaker and the indexes in the lower panels, much weaker, never bouncing back above the moving average and thus, establishing downtrends and a bearish blueprint for the SPX, which finally followed through as well. The bottom line is that, excepting a very few indexes, like the Dow Jones Internet index (note: AMZN is joining EBAY in getting destroyed on earnings as I write this on Thursday night) the US stock market is now in an intermediate bear trend across the board (subject to the current would-be ‘bounce’ scenario, which has well defined resistance as noted on all of these charts).
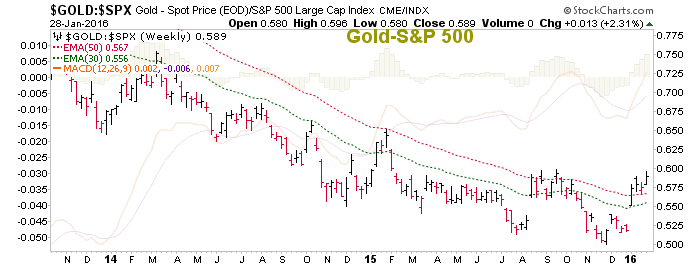
The situation is much like 2000, when certain aspects of the market had entered a bear while the average American looked at the Dow and S&P 500 and thought happy thoughts. We are well along in the analog to the 1999-2001 time frame. But what of gold’s ratio to these markets, which is that big planet right out front in our graphic?
Here is the simple weekly chart we use in NFTRH. As you can see, the trend has not yet changed although constructive work is being done here and now as gold remains above the weekly EMAs 30 and 50. A sustained breakout above the highs of last summer is needed to change the trend in ‘gold vs. S&P 500’.
Why is this needed? Because we are managing a slow decline in confidence that the Fed has enjoyed since putting gold on the outs back in 2011 with the brilliant, inflation “sanitizing” (the Fed’s word for it) Operation Twist. Anecdotally, I see people in the mainstream media and financial social media getting pissed off at Janet Yellen’s hard stance on policy tightening [edit: as this article was about to be published on Friday morning, we learn that the BoJ has just joined the ECB in the 2016 globally competitive inflation sweepstakes].
A decline in confidence would be good for gold, but we are not quite there yet. If the chart above were to break out to a new trend and people were choosing gold over the conventional safe haven, Treasury bonds, gold bugs would be well on their way. As you can see, gold is still going nowhere vs. long-term Treasury bonds. Indeed, we have had recent NFTRH+ highlights on TLT and TIP, each of which I own.
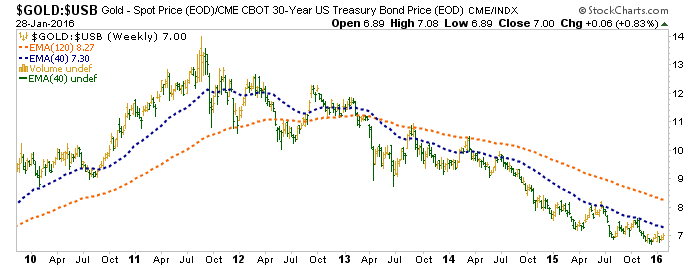
Speaking of long-term, I took my long-term position in gold in 2002-2004 and see no reason not to stay that course for that portion of the portfolio. It’s an anchor, a counterweight with a specific purpose of insurance and monetary value.
But for those sports fans playing in the speculative end of the sector, namely the miners, timing is everything. This is a simplified version of some detailed charts we review consistently in NFTRH so as to be right on time when signals not only from nominal gold, silver and HUI, but their ratios to each other and other markets/assets, are triggered.
Bottom Line
The stock market is on a labored ‘bounce’ scenario and gold has not yet broken upward in S&P 500 units. If the bounce continues, the wait could be a while longer. But assuming the bounce fails at or below noted resistance levels (best target is SPX 2000), the Gold-SPX ratio eventually breaks out and Gold vs. Long-term Treasury bonds finally bottoms, some major signals would be in place for the next bull market in the precious metals.
There are many more signals involved than those outlined above, many of which have already become favorable; Gold-Commodities for one. But the Gold-Silver ratio probably has to find a top and yield spreads a bottom in order to signal that inflation is starting to brew out there in a world that (ex-US lately) has been inflating non-stop [edit: again, hello BoJ].
2016 has the feel of something coming to a head and it is exciting to be gauging its progress in real time and it will be even more exciting when we are able to finally take action on the trend changes that look likely. Consider an affordable NFTRH subscription and I promise you even though I have no crystal ball we will consistently do the work necessary going forward in order to be on the right side of events, whether they are as expected or some other scenario currently less favored.
Subscribe to NFTRH Premium for your 25-35 page weekly report, interim updates (including Key ETF charts) and NFTRH+ chart and trade ideas or the free eLetter for an introduction to our work. Or simply keep up to date with plenty of public content at NFTRH.com and Biiwii.com.
By Gary Tanashian
© 2016 Copyright Gary Tanashian - All Rights Reserved
Disclaimer: The above is a matter of opinion provided for general information purposes only and is not intended as investment advice. Information and analysis above are derived from sources and utilising methods believed to be reliable, but we cannot accept responsibility for any losses you may incur as a result of this analysis. Individuals should consult with their personal financial advisors.
Gary Tanashian Archive |
© 2005-2022 http://www.MarketOracle.co.uk - The Market Oracle is a FREE Daily Financial Markets Analysis & Forecasting online publication.


