


A Giga Breakout In A Mid-Sized Gold Miner
Commodities / Gold and Silver Stocks 2016 Feb 04, 2016 - 10:47 AM GMTBy: InvestingHaven

 Gold has broken through its important resistance point at $1,130 USD/oz. That is an important price point, as it coincides with gold’s 200 day moving average and the midpoint in the trend channel that started in July of 2013 (see first chart).
We have published our gold price chart several times, but it remains a spot-on chart. Below is the latest version. As clearly seen, major resistance kicks in around $1,210 USD/oz, which is 6.1% above today’s closing price. If gold manages to break through that level, we believe a major trend change would be underway.

As the price of gold is surging, gold miners are going higher as well. We are not including the charts of the gold mining indexes like GDX or HUI, as they only show a recovery from a major bottom. For this article, we have chosen to focus on one particular gold miner with an extremely constructive chart setup. It is a mid-sized miner, with a market cap of $3B, production from one important gold mining, several exploration activities, production of 505k ounces of gold in 2015, and a cash position of $160M at the end of 2015.
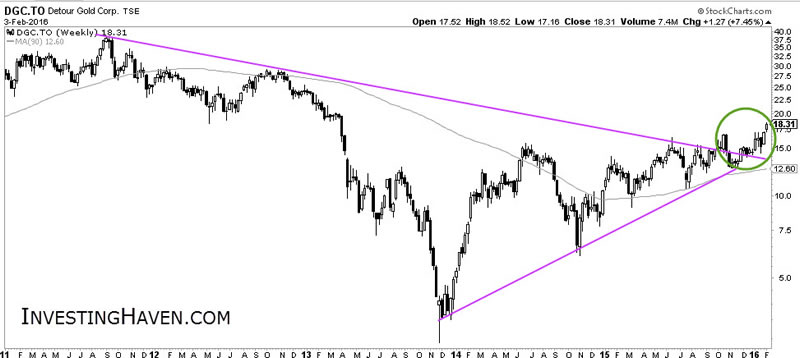
We are not into fundamental analysis of mining companies, but we simply look into the charts, and try to read what the market says about it. When it comes to Detour Gold, the market says that it is a great stock with great fundamentals. Our own view is that it is one of the best looking gold miners out of several hundreds we are tracking. Both the long and short term charts are great, as they show a confirmed breakout.
The weekly chart confirmed a giga breakout in January of this year. The descending trendline goes back to the peak of the price of gold in 2011.
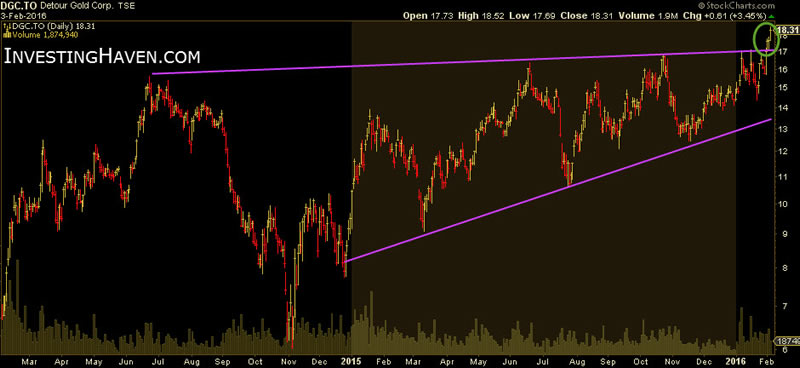
The shorter term chart shows a confirmation as well, although with a different setup. We do not think we should add any comment, as the chart speak for itself.
CONCLUSION:
Detour Gold is a great stock to hold. There is not much resistance on its chart. We would like to recommend to become cautious as soon as gold hits major resistance at $1,210 /oz.
Analyst Team
The team has +15 years of experience in global markets. Their methodology is unique and effective, yet easy to understand; it is based on chart analysis combined with intermarket / fundamental / sentiment analysis. The work of the team appeared on major financial outlets like FinancialSense, SeekingAlpha, MarketWatch, ...
Copyright © 2015 Investing Haven - All Rights Reserved Disclaimer: The above is a matter of opinion provided for general information purposes only and is not intended as investment advice. Information and analysis above are derived from sources and utilising methods believed to be reliable, but we cannot accept responsibility for any losses you may incur as a result of this analysis. Individuals should consult with their personal financial advisors.
© 2005-2022 http://www.MarketOracle.co.uk - The Market Oracle is a FREE Daily Financial Markets Analysis & Forecasting online publication.