


Gold And Silver – Charts Only
Commodities / Gold and Silver 2016 Feb 20, 2016 - 05:18 PM GMTBy: Michael_Noonan

 We are strong advocates of the charts providing the best and most reliable information. Even the most respected gold and silver experts do not know when the effects of globalist bankers' manipulation will lose their impact. Each week is one week closer to a final resolve, but no one knows if there are 2 more weeks, 20 more weeks or how much longer price can continue sideways to lower in a bottoming process.
Back on the 6th of February, we posited that there was no bottom confirmed, [See Is A Bottom In? Nothing Confirmed , if you missed the article.], and we maintain that there has not been any identified market activity that suggests a final bottom for the current multi- year correction lower. This week, we focus strictly on the charts.
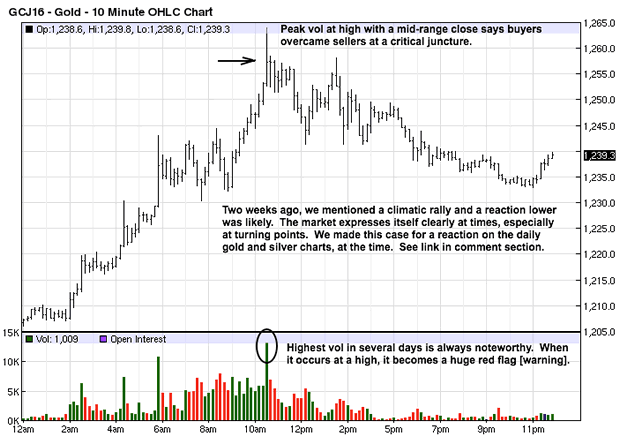
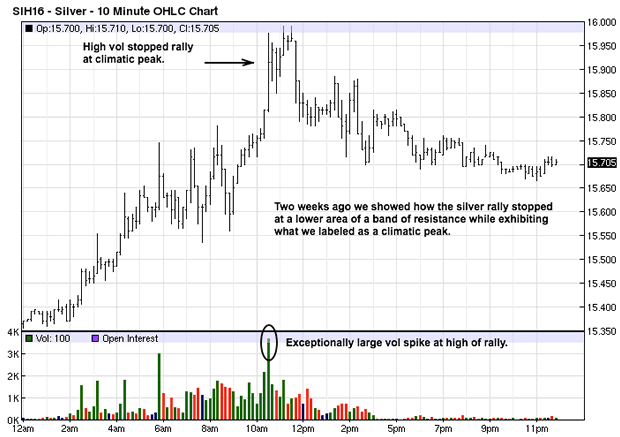
Usually, we start with the higher time frame. This 10 minute intra day chart is one we forgot to include in our previous commentary, but it is still apt for the current market situation. Two weeks ago, we said the gold and silver markets were in a climatic position for a reaction lower. [See discussion on daily chart under gold]. This was one of those times when the market was clearly expressing its intent to pull back after that rally.
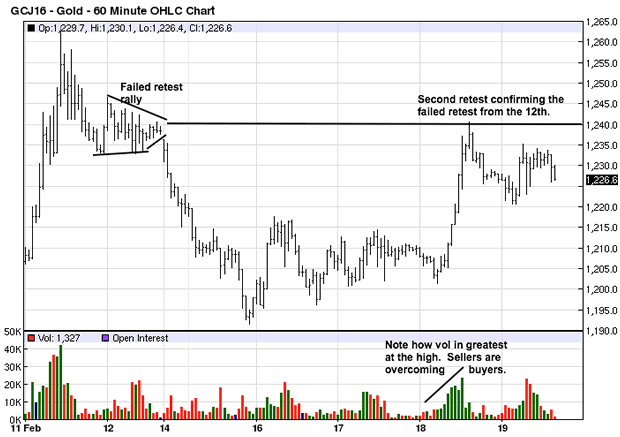
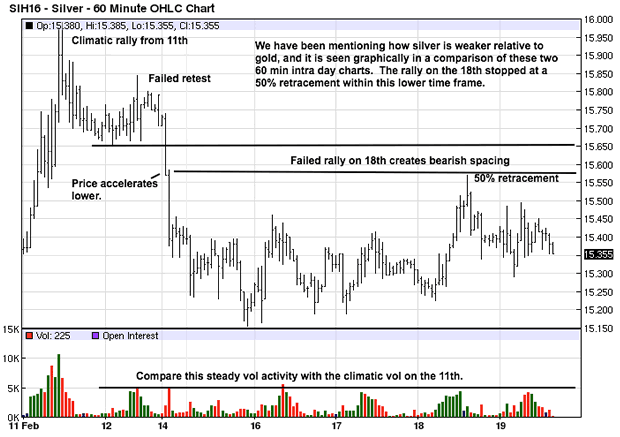
This current 60 minute chart shows how pertinent the climatic volume was on the 11th.
Markets are constantly testing and retesting past market activity across all time frames, and it shows up clearly in this intra day chart. The weak retest rally of the 12th led to more decline, and last Thursday was yet another retest.
We often mention how one form of market activity is needed to confirm a previous area of market activity. Here, the retest on the 18th was confirming the failure rally of the 12th, and in turn, the 12th confirming the rally peak of the 11th. This is also an example of how higher time frames give way to the lower time frames for the market timing of trades.
In a buying environment, stronger volume occurs at the bottom. When the highest volume develops at the high of a rally, it is usually a red flag warning that sellers are taking control. You can see how volume developed on the 18th as price rallied into an area of resistance. The steady increase in volume as price rallied indicates sellers were stepping up their activity, and the results are apparent.
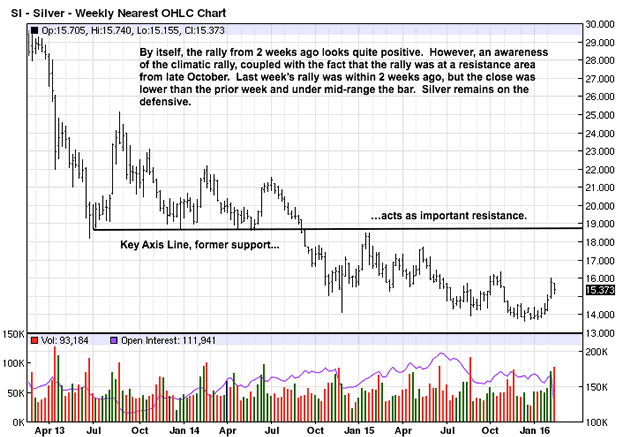
This week's close is at the high of the weekly range, but the reward is lacking because price did not make any upside progress on almost equal volume to the prior week. We expect more sideways to lower price behavior, at least near term, based on the message from the charts.
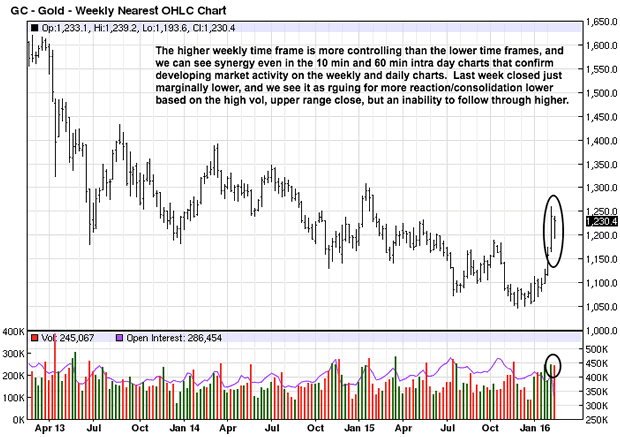
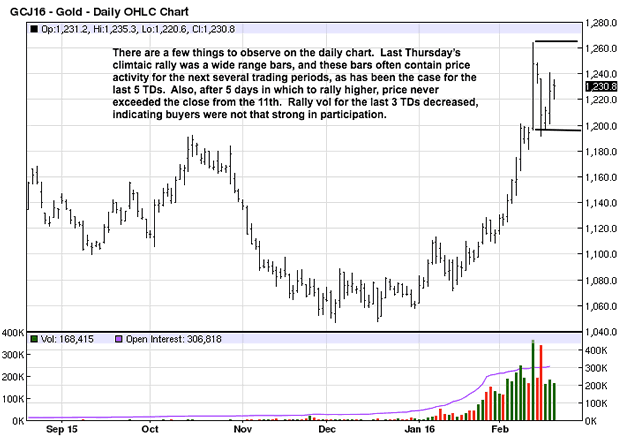
Chart comments need not be repeated. The last 3 day rally attempt was on decreased volume and upward progress has been lacking. What will be interesting to observe is the extent to which a reaction lower, if any, develops. A shallow correction will be positive feedback with support starting at 1180 - 1192.
Given the worsening world financial situation, keep accumulating physical gold and silver.
The alternatives are few, in terms of preserving purchasing power of one's diminishing paper assets, and you can expect all paper assets to lose perceived "value."
See our article on pensioners losing out to market reality and government interference, 400,00Americans In Jeopardy As Giant Pension Fund Plans 50% Benefit Cuts , for a look at what is actually going on, present tense, and expect things to worsen considerably.
Silver showed the same climatic action as did gold, back on the 11th, and we made [See] comments on the daily charts as price developed, at the time.
The weakness of silver relative to gold, as we have been saying for the past few months, is very clear on this chart. The retest rally on the 18th was much shorter than was gold's, and silver left a space between the swing low of the 12th and swing high on the 18th, creating an example of bearish spacing. One hardly ever sees bearish spacing in an up market, so this is still an indication that silver remains in a down trend, or more defensive than any ability to sustain rallies. The swing high on the 18th also stopped at a 50% retracement, typical of a weak market.
Resistance just under $19 is obvious, and we can see how even $16 has become a barrier for upside progress. These are some of the benchmarks to watch for if and when a trend change may be in the making. For as long as these areas remain intact, there will be no change in trend regardless of how many call for such already change in progress. [Not.]
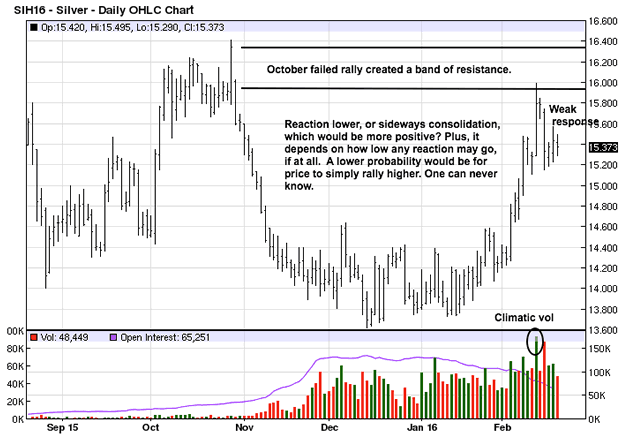
The daily chart show how the last several days of trading have been relatively weak in any ability to sustain the prior week's tenuous gains. As with gold, how much of a correction, if any, that may ensue in the weeks ahead will be a barometer for the possibility for a change, or just more of the same.
Markets are always testing and retesting, and that activity provides some of the best insight into what to expect moving forward, regardless of the already known strong fundamental factors that are not moving these markets. The globalists remain in charge. The best preparation is to keep buying the physical, both gold and silver, and we continue to favor purchasing silver over gold.
By Michael Noonan
Michael Noonan, mn@edgetraderplus.com, is a Chicago-based trader with over 30 years in the business. His sole approach to analysis is derived from developing market pattern behavior, found in the form of Price, Volume, and Time, and it is generated from the best source possible, the market itself.
© 2016 Copyright Michael Noonan - All Rights Reserved Disclaimer: The above is a matter of opinion provided for general information purposes only and is not intended as investment advice. Information and analysis above are derived from sources and utilising methods believed to be reliable, but we cannot accept responsibility for any losses you may incur as a result of this analysis. Individuals should consult with their personal financial advisors.
Michael Noonan Archive |
© 2005-2022 http://www.MarketOracle.co.uk - The Market Oracle is a FREE Daily Financial Markets Analysis & Forecasting online publication.