


U.S. Inflation: Prepare for 4% or more!
Economics / Inflation Feb 22, 2016 - 02:53 PM GMTBy: Ned_W_Schmidt

 Last we visited on the subject of U.S. inflation (November, 2015) we wrote,
"Using those simplistic numbers suggests that U.S. inflation as measured by the [headline] CPI could rise to an annual rate of about 4% ..."
That possibility is now increasingly likely given recent rise in U.S. inflation. This view is reaffirmed by recent data. If an error exists in this projection, it is to underestimate potential for inflation in U.S. to rise.
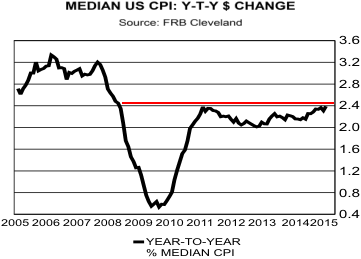
Analyzing the state of U.S. inflation begins with the median CPI produced monthly by Federal Reserve Bank of Cleveland. What is the median CPI? To calculate the headline CPI for any particular month the rate of change is calculated for each of the components of the CPI such as energy, food, and housing. Headline CPI is then calculated by weighting each of those components to produce a weighted average. Median CPI is that rate of change for which half of the components had a higher rate of change and half had a lower rate of change. It divides a ranking of the component rates of inflaton in half. The median is less impacted by extreme changes in the prices for anycomponent which can in someways distort the weighted average CPI.
In top chart is plotted the year-to-year percentage change for the median CPI. Two observations are worthy of mention. These observations suggest that expectations of higher U.S. inflation are reasonable and likely to be correct. First, the latest observation exceeds the previous high. Second, in January the year-to-year percentage change rose to the highest level since 2009.
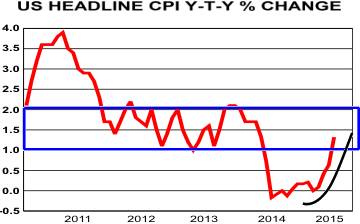
Before we move to what the median CPI might be saying about U.S. inflation, let us take a brief look at recent developments in U.S. inflation. In chart to right is plotted the year-to-year percentage change for the headline CPI. Notice that it has risen fairly dramatically in recent months. See arrow.
Era of no inflation is over. U.S. inflation has moved back into a "trading range" of 1-2% in which it had moved for several years. That may suggest the low inflation experienced was an aberration, not an equilibrium state.
Chart below compares the year-to-year percentage change for the headline CPI, black line, with that for the median CPI, red line. Twice early in the chart the headline CPI moved below the median CPI. In both of those cases the headline CPI rate of change turned up and moved above the median CPI. In the first of those cases the rise in the headline CPI rate of change was roughly 4 percentage points from low to high, as highlighted by blue arrow.
In the second case the rise from low to first high was about 4.5 percentage points and 6 percentage points to the ultimate high in the rate of headline inflation.
Median CPI is one of several measures of central tendency, as is the weighted average used for the headline CPI. However, the median is not distorted by high and low values as is the case with averages. Note how far less volatile the median is compared to the weighted average. It may be in the above instance the better measure of central tendency. It seems to act as a "magnet" for the headline CPI, returning the calculation to a more "normal" reading.
In the more recent data, right hand side of graph, the headline CPI is below is running below the median and it has turned up sharply. Current situation is developing much like the earlier two cases. Using4 percentage points as suggested by those earlier moves, a common number in the above discussion, suggests that the headline CPI which had a low of roughly 0% is likely beginning a move to 4%, as highlighted by the third blue arrow, or higher. Several factors, which includes time and the mechanics of averaging, may contribute to coming rise in U.S. headline inflation.
First of those is oil prices. Writers seem to often have difficulty with verb tense. Oil prices have fallen, meaning yesterday. Oil prices are not falling, meaning present time. Looking forward from today, oil prices are likely to rise, though perhaps by not much. Commodity price are self correcting, though often the process is lengthy. The "dividend checks" from the oil price slide have largely been cashed and spent. Those declining oil prices did have a tendency to depress other prices. That good news is slowly fading into history. Oil prices should now begin to buoy and then cause other prices to rise.
The speculative advance in the value of the U.S. dollar against other currencies is beginning to fade. Rising value of the dollar depressed dollar denominated prices as foreign purchasers could not and cannot afford those dollar denominated commodities and goods. The value of their currency having fallen means foreign consumers cannot purchase the same amount of U.S. goods and commodities. A simple ending of the speculative advance will begin to support dollar denominated prices. And if it declines as it should, dollar denominated prices will rise.
Third is the long overdue normalization of interest rates in the U.S. While the path is unclear, the need to remove the interest rate distortions in the U.S. economyseems obvious to the Federal Reserve. Abnormally low interest rates of recent years have caused funds to shift to the financial sector. Prices of financial assets rose, but are ignored in the calculation of inflation. Normalization of interest rates will shift funds from speculation in financial markets to the real economy, which is included in the calculation of the CPI. As fund flow from speculation to real activity, prices in latter sector should firm and rise, pushing up the CPI.
With U.S. inflation headed to 4%, and likely higher, is your portfolio positioned to prosper? The "markets" have already begun to discount this development. Fantasy "growth" stocks have fallen, and continue to be the most vulnerable. Gold has moved sharply higher, jumping by more than $200 at one point. Gold stock ETFs have risen from their lows by more than 40%. These market adjustments are a reminder to investors that diversification is still smarter than any and all strategists. If you have missed the first step in a new Gold bull market, today is the time to correct that inefficiency.
By Ned W Schmidt CFA, CEBS
Ned W. Schmidt,CFA has had for decades a mission to save investors from the regular financial crises created by economists and politicians. He is publisher of The Value View Gold Report, monthly, with companion Trading Thoughts. To receive these reports, go to: www.valueviewgoldreport.com Follow us @vvgoldreport
Copyright © 2016 Ned W. Schmidt - All Rights Reserved
Ned W Schmidt Archive |
© 2005-2022 http://www.MarketOracle.co.uk - The Market Oracle is a FREE Daily Financial Markets Analysis & Forecasting online publication.