


Silver Price Rise Will Be Quick And Sudden
Commodities / Gold and Silver 2016 Mar 08, 2016 - 03:16 PM GMTBy: Hubert_Moolman

 The rise of silver and the collapse of the monetary system is inescapably linked, since the monetary system is built upon the suppression of silver. Collapse by definition suggests: to break or fall suddenly. This is exactly what will happen to the international monetary system, very soon.
Therefore, silver's rise will likely be very quick or sudden. It is for this reason that one cannot really trade this coming silver bull market. The best option is to keep on increasing one's silver ounces. When the time comes, silver will explode higher suddenly; for example, it could be possible that it rises $10, $20, $100 a day, until you cannot buy it with fiat money.
The best examples we have of how this could happen is around 1933 and the late 70s. Around 1933, the US monetary system was under huge pressure to fulfill their gold obligations, due to the big demand for gold, as previously explained . This big demand for gold created a spike in the international market, where gold went from about $20 at the end of 1932 to $35 in 1934 (as per LBMA PM London Fix). Note that the US revaluation of gold was actually forced by the international gold market.
During this same period silver went from 28 cents to 48 cents (as per LBMA PM London Fix), and eventually peaked at 64 cents in 1935 ; thus, outperforming gold quite a bit. This rise of gold and silver was really quick and sudden, and in my opinion, not really tradable (you just had to be ready when it happened).
In the late 70s, especially in 1979; silver had an incredible price rise in a very short period of time. The current condition is a lot similar to how the 1979 situation was, as confirmed by the fractals (patterns) on the silver charts below:
The top chart is silver from 1966 to the end of 1979, and the bottom is silver from 1999 to August 2015. I have highlighted key events on both charts to show how the structure of the two bull markets could be similar. The current structure is bigger in terms of time and price movement.
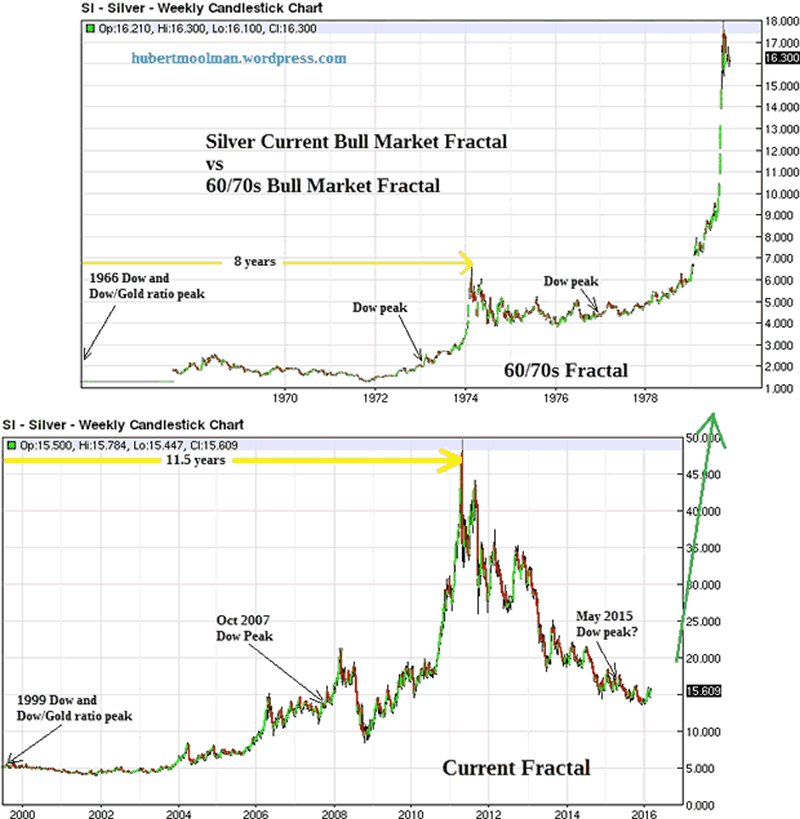
If the current pattern follows the 70s pattern, then we will see a sudden spike in silver at any time (over the next 2 years). This would be consistent with what one would expect when the monetary system collapses. The above fractal analysis pattern, is confirmed when silver goes higher than the $50 peak.
Warm regards,
For more of this kind of analysis on silver and gold, you are welcome to subscribe to my premium service. I have also recently completed a Long-term Silver Fractal Analysis Report .
Warm regards
Hubert
“And it shall come to pass, that whosoever shall call on the name of the Lord shall be saved”
http://hubertmoolman.wordpress.com/
You can email any comments to hubert@hgmandassociates.co.za
© 2016 Copyright Hubert Moolman - All Rights Reserved
Disclaimer: The above is a matter of opinion provided for general information purposes only and is not intended as investment advice. Information and analysis above are derived from sources and utilising methods believed to be reliable, but we cannot accept responsibility for any losses you may incur as a result of this analysis. Individuals should consult with their personal financial advisors.
© 2005-2022 http://www.MarketOracle.co.uk - The Market Oracle is a FREE Daily Financial Markets Analysis & Forecasting online publication.