


Crude Oil Price Meets Support
Commodities / Crude Oil Mar 31, 2016 - 12:26 PM GMTBy: Nadia_Simmons

 Trading position (short-term; our opinion): No positions are justified from the risk/reward perspective.
On Tuesday, crude oil lost 2.06% ahead of the American Petroleum Institute's weekly inventory report. Thanks to this drop, light crude closed another day under $39, but reached important support zone. Will it encourage oil bulls to act in the coming days?
Yesterday, crude oil extended losses after the market’s open as concerns over another increase in crude oil inventories to record highs affected negatively investors’ sentiment, which resulted in a drop to intraday low of $37.91. Despite this decline, the commodity erased some losses after Federal Reserve Chair Janet Yellen dampened expectations for an upcoming U.S. rate hike (if you would like to know more about real interest rates click here), which pushed the USD Index lower, making light crude more attractive for buyers holding other currencies. Will we see further improvement in the coming days? Let’s examine charts and find out what can we infer from them (charts courtesy of http://stockcharts.com).
Quoting our previous alert:
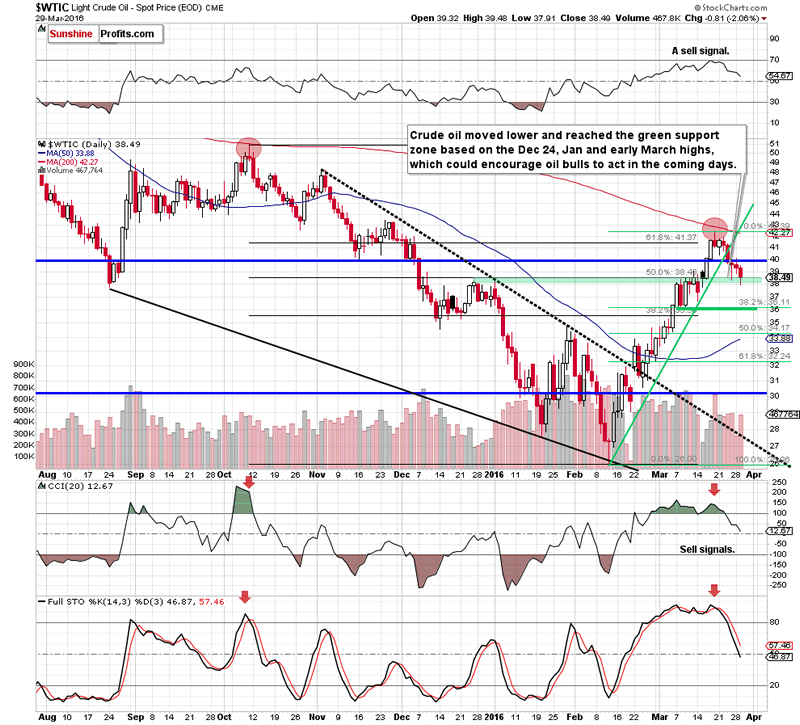
(…) although crude oil came back above $40 yesterday, this improvement was very temporary as oil bulls didn’t manage to hold gained levels. As a result, light crude reversed and declined below $39, which suggests a re-test of the green support zone (around $38.09-$38.39) or even a drop to the medium-term red declining support line (currently around $37.85)
From today’s point of view, we see that the situation developed in line with the above scenario and crude oil reached our downside target area. Taking into account the fact that the current correction is quite shallow (it didn’t even reach the 38.2% Fibonacci retracement) and the proximity to the medium-term red declining support line, it seems to us that oil bulls could take their chance and trigger a rebound from here in the coming days. If this is the case, and we’ll see such price action, light crude could re-test the strength of the psychological barrier of $40 in the coming days.
Finishing today’s alert, please keep in mind our yesterday’s commentary:
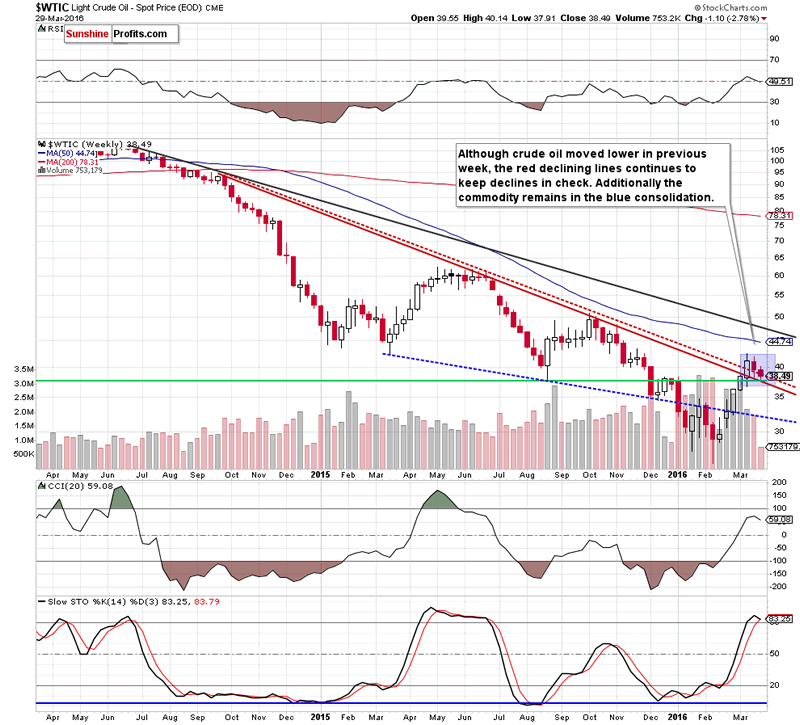
(…) in our opinion, further deterioration will be more likely and reliable if we see an invalidation of the breakout above this important support line. (…) we also see that crude oil is trading in a blue consolidation, which suggests that a drop under the lower line of the formation will likely accelerate declines.
Summing up, crude oil re-tested the green support zone (marked on the daily chart) and approached the medium-term red declining support line (seen on the weekly chart), which could encourage oil bulls to act and result in an increase to the barrier of $40 in the coming week.
Very short-term outlook: mixed
Short-term outlook: mixed
MT outlook: mixed
LT outlook: mixed
Trading position (short-term; our opinion): No positions are justified from the risk/reward perspective.
As a reminder – “initial target price” means exactly that – an “initial” one, it’s not a price level at which we suggest closing positions. If this becomes the case (like it did in the previous trade) we will refer to these levels as levels of exit orders (exactly as we’ve done previously). Stop-loss levels, however, are naturally not “initial”, but something that, in our opinion, might be entered as an order.
Since it is impossible to synchronize target prices and stop-loss levels for all the ETFs and ETNs with the main market that we provide this level for (crude oil), the stop-loss level and target price for popular ETN and ETF (among other: USO, DWTI, UWTI) are provided as supplementary, and not as “final”. This means that if a stop-loss or a target level is reached for any of the “additional instruments” (DWTI for instance), but not for the “main instrument” (crude oil in this case), we will view positions in both crude oil and DWTI as still open and the stop-loss for DWTI would have to be moved lower. On the other hand, if crude oil moves to a stop-loss level but DWTI doesn’t, then we will view both positions (in crude oil and DWTI) as closed. In other words, since it’s not possible to be 100% certain that each related instrument moves to a given level when the underlying instrument does, we can’t provide levels that would be binding. The levels that we do provide are our best estimate of the levels that will correspond to the levels in the underlying assets, but it will be the underlying assets that one will need to focus on regarding the sings pointing to closing a given position or keeping it open. We might adjust the levels in the “additional instruments” without adjusting the levels in the “main instruments”, which will simply mean that we have improved our estimation of these levels, not that we changed our outlook on the markets.
Thank you.
Nadia Simmons
Forex & Oil Trading Strategist
Przemyslaw Radomski
Founder, Editor-in-chief
Sunshine Profits: Gold & Silver, Forex, Bitcoin, Crude Oil & Stocks
Stay updated: sign up for our free mailing list today
* * * * *
Disclaimer
All essays, research and information found above represent analyses and opinions of Nadia Simmons and Sunshine Profits' associates only. As such, it may prove wrong and be a subject to change without notice. Opinions and analyses were based on data available to authors of respective essays at the time of writing. Although the information provided above is based on careful research and sources that are believed to be accurate, Nadia Simmons and his associates do not guarantee the accuracy or thoroughness of the data or information reported. The opinions published above are neither an offer nor a recommendation to purchase or sell any securities. Nadia Simmons is not a Registered Securities Advisor. By reading Nadia Simmons’ reports you fully agree that he will not be held responsible or liable for any decisions you make regarding any information provided in these reports. Investing, trading and speculation in any financial markets may involve high risk of loss. Nadia Simmons, Sunshine Profits' employees and affiliates as well as members of their families may have a short or long position in any securities, including those mentioned in any of the reports or essays, and may make additional purchases and/or sales of those securities without notice.
© 2005-2022 http://www.MarketOracle.co.uk - The Market Oracle is a FREE Daily Financial Markets Analysis & Forecasting online publication.