


Forex Trading - EUR/USD Increases – What About USD/CAD?
Currencies / Euro Apr 01, 2016 - 12:17 PM GMTBy: Nadia_Simmons

 Yesterday, the greenback moved sharply lower against the Canadian dollar despite bullish ADP report and declining crude oil prices as sentiment on the U.S. dollar remained weak after Janet Yellen’s speech. As a result, USD/CAD dropped under important support line. How low could the exchange rate go in the coming days?
In our opinion, the following forex trading positions are justified – summary:
EUR/USD: short (stop-loss order at 1.1512; initial downside target at 1.0572)
GBP/USD: none
USD/JPY: none
USD/CAD: none
USD/CHF: none
AUD/USD: none
EUR/USD
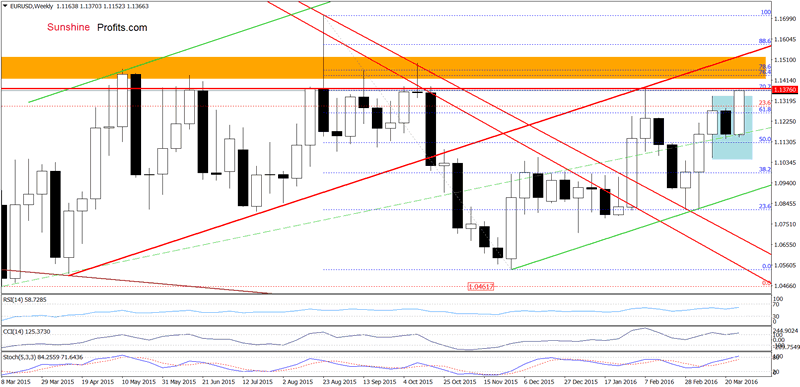
From the medium-term perspective, we see that that EUR/USD rebounded sharply and erased all Feb declines after the ECB lowered its deposit rate deeper into negative territory (a negative interest-rate policy) earlier this month. With this upward move, the pair climbed above the upper border of the blue consolidation yesterday, which is a positive signal. Nevertheless, despite the recent increase, the exchange rate remains under the Feb high, the 70.7% Fibonacci retracement (based on the Aug-Nov declines) and the key orange resistance zone which successfully stopped currency bulls several times in the past. Therefore, in our opinion, as long as the pair is trading under these levels another reversal from here and lower values of the exchange rate are very likely.
Very short-term outlook: bearish
Short-term outlook: bearish
MT outlook: mixed with bearish bias
LT outlook: mixed
Trading position (short-term; our opinion): Short positions (with a stop-loss order at 1.1512 and the initial downside target at 1.0572) are justified from the risk/reward perspective. We will keep you informed should anything change, or should we see a confirmation/invalidation of the above.
USD/JPY
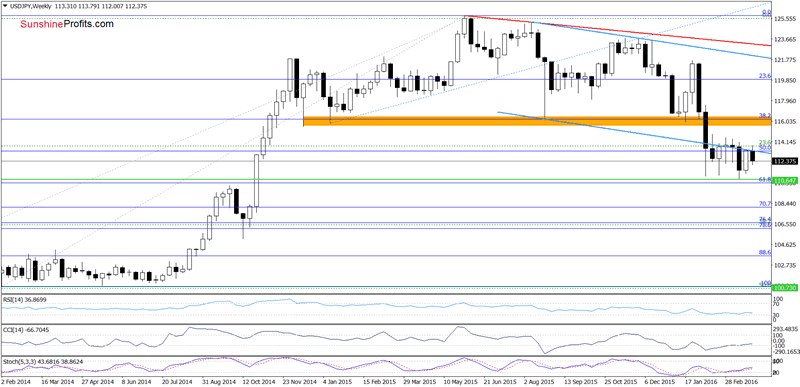
As you see on the weekly chart although USD/JPY moved slightly above the lower border of the blue declining trend channel, this improvement was very temporary and currency bulls didn’t manage to hold gained levels. As a result, the exchange rate gave up some gains and dropped under the blue line, invalidating earlier breakout. This negative signal triggered further deterioration and USD/JPY declined below 113.
How did this move affect the very short-term picture? Let’s check.
Quoting our previous commentary on this currency pair:
(…) the pair also climbed to the red resistance line based on the previous highs, which suggests that we may see reversal in the coming days. This scenario is also reinforced by the current position of the Stochastic Oscillator, which is overbought and very close to generating a sell signal. If this is the case and USD/JPY declines from here, the initial downside target would be around 122.60, where the 38.2% Fibonacci retracement (based on the recent upward move) is.
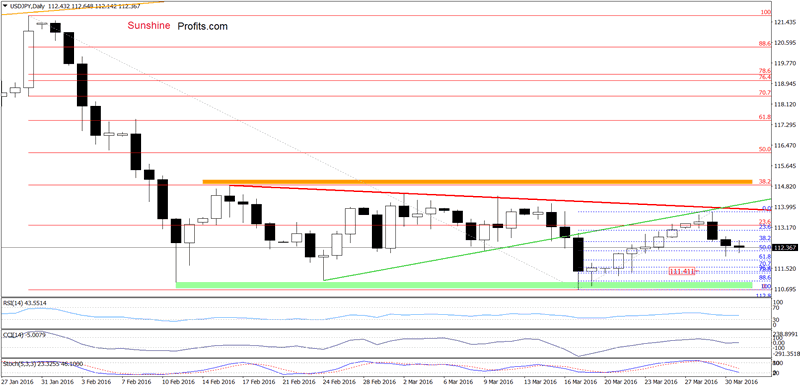
Looking at the daily chart, we see that currency bears pushed the pair lower as we had expected. With this downward move, USD/JPY not only slipped to our first downside target, but also dropped below it, which in combination with sell signals generated by the indicators suggests that further declines are likely. Therefore, if the pair extends losses, we may see a drop even to around 111.34-111.41, where the support area created by the 76.4% and 78.6% Fibonacci retracement levels is.
Very short-term outlook: mixed with bearish bias
Short-term outlook: mixed
MT outlook: mixed
LT outlook: mixed
Trading position (short-term; our opinion): No positions are justified from the risk/reward perspective at the moment.
USD/CAD
Quoting our last commentary on this currency pair:
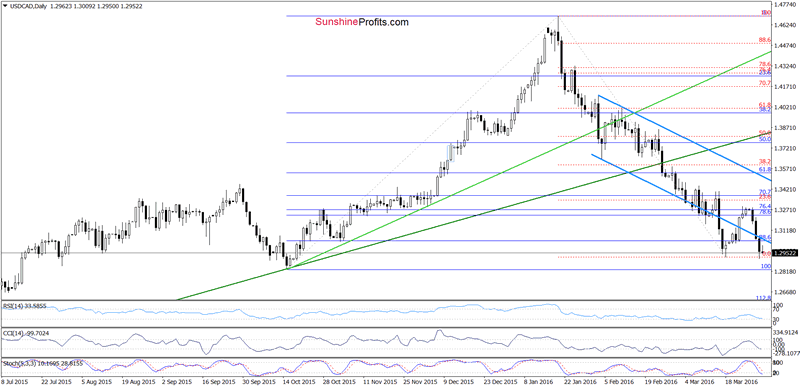
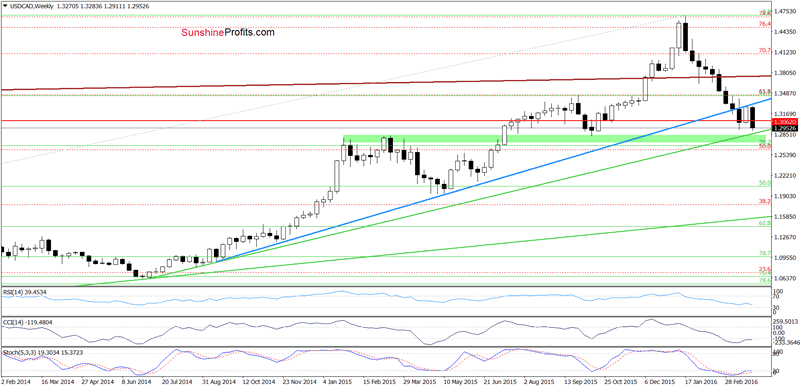
(…) we should keep in mind that the size of move is quite small as USD/CAD didn’t even reach the 23.6% Fibonacci retracement based on the entire Jan-March decline. Are there any other factors that could hinder the realization of a pro-growth scenario? Let’s examine the weekly chart (…) From this perspective, we see that this week’s upswing took USD/CAD to the previously-broken medium-term blue line, which suggests that as long as there won’t be invalidation of the breakdown under this resistance all upswings could be just a verification of earlier breakdown.
From today’s point of view we see that USD/CAD verified earlier breakdown under the medium-term blue line (as we had expected), which encouraged currency bears to act and resulted in a sharp decline. Thanks to this move, the exchange rate dropped under the lower border of the blue declining trend channel (marked on the daily chart) and reached the March low yesterday. What’s next? Taking into account the medium-term picture and sell signals generated by the daily indicators, we think that further deterioration is just around the corner and USD/CAD will test the Oct low and the green support zone (which is also reinforced by the medium-term green support line) in near future.
Very short-term outlook: mixed with bearish bias
Short-term outlook: mixed
MT outlook: mixed
LT outlook: mixed
Trading position (short-term; our opinion): No positions are justified from the risk/reward perspective at the moment.
Thank you.
Nadia Simmons
Forex & Oil Trading Strategist
Przemyslaw Radomski
Founder, Editor-in-chief
Sunshine Profits: Gold & Silver, Forex, Bitcoin, Crude Oil & Stocks
Stay updated: sign up for our free mailing list today
* * * * *
Disclaimer
All essays, research and information found above represent analyses and opinions of Nadia Simmons and Sunshine Profits' associates only. As such, it may prove wrong and be a subject to change without notice. Opinions and analyses were based on data available to authors of respective essays at the time of writing. Although the information provided above is based on careful research and sources that are believed to be accurate, Nadia Simmons and his associates do not guarantee the accuracy or thoroughness of the data or information reported. The opinions published above are neither an offer nor a recommendation to purchase or sell any securities. Nadia Simmons is not a Registered Securities Advisor. By reading Nadia Simmons’ reports you fully agree that he will not be held responsible or liable for any decisions you make regarding any information provided in these reports. Investing, trading and speculation in any financial markets may involve high risk of loss. Nadia Simmons, Sunshine Profits' employees and affiliates as well as members of their families may have a short or long position in any securities, including those mentioned in any of the reports or essays, and may make additional purchases and/or sales of those securities without notice.
© 2005-2022 http://www.MarketOracle.co.uk - The Market Oracle is a FREE Daily Financial Markets Analysis & Forecasting online publication.