Natural Gas Rebound Meets Resistance
Commodities / Natural Gas Apr 13, 2016 - 01:05 PM GMTBy: AnyOption
 The recovery in gas prices from the March lows continues to play out, although it is increasingly evident that fundamental conditions will not alleviate the downside pressure on prices over the near-to-medium term especially as seasonal demand factors subside. With production possibly to climb amid higher prices, the stage is set for a renewed downturn in prices following the technical correction higher in prices, aided in part by a brief cold front that swept across the United States. Demand growth on its own will not be enough to offset the record seasonal storage levels, with only falling supply helping to correct the ongoing imbalance.
Storage Levels Well Above Average
As the warmer summer months come to North America, the amount of gas in storage continues to climb, with current inventories standing 2.480 trillion cubic feet as of the week ending April 1st. Gas currently held in storage is 68.50% higher than when levels were measured a year ago and 54.40% above the five-year average, hurting the outlook for prices especially if supply continues to outpace demand by a wide margin. In the meantime and before the summer conditions are upon the lower 48 states, the recent cold stretch that hit the Midwest states is helping to boost demand near-term and keep prices elevated above the $2.000 per MMBtu level despite the host of fundamental risk factors. Typically the winter months are market by inventory drawdowns as evidenced by increased heating demand, but now that colder conditions have abated, the stage is set for another massive inventory build.
Adding to rising supply is US imports from Canada which climbed by approximately 1 billion cubic feet per day, with total Canadian exports to the US increasing 23.20% week over week. Growing supply comes amid strong gas demand for energy generation all the while industrial demand continues to fall. With consumer demand forecast to fall over the coming months, energy production will be the primary demand driver moving forward. However, increased supply will not necessarily have the same impact on prices as the parallel situation in the oil industry. While oil inventory levels are climbing to near capacity, total working gas storage availability is estimated at 4.658 trillion cubic feet. Even after gas saw a record 4.009 trillion cubic feet in storage during November of 2015, storage concerns are only likely to be felt in fall months if weather conditions remain warm.
Production Increasing With Prices
Although natural gas prices are still rising off the depths of the March lows, incremental gains in prices are bringing marginal producers back into the fold, raising the possibility of more supply hitting the market in the coming weeks. According to the Baker Hughes rig count report released on April 8th, the US gas rig count climbed by 1 in the prior week to 89 active rotary rigs. If prices continue to improve further, producers are likely to begin ramping up production to reflect the increase. Helping prices remain elevated is robust demand thanks in large part to rising energy production needs, with gas forecast to produce as much power as coal for the whole of 2016. However, one area where demand may continue shrinking is related to industrial production as output levels continue to fall on an aggregate basis across the United States.
Prices Preparing for a Breakout
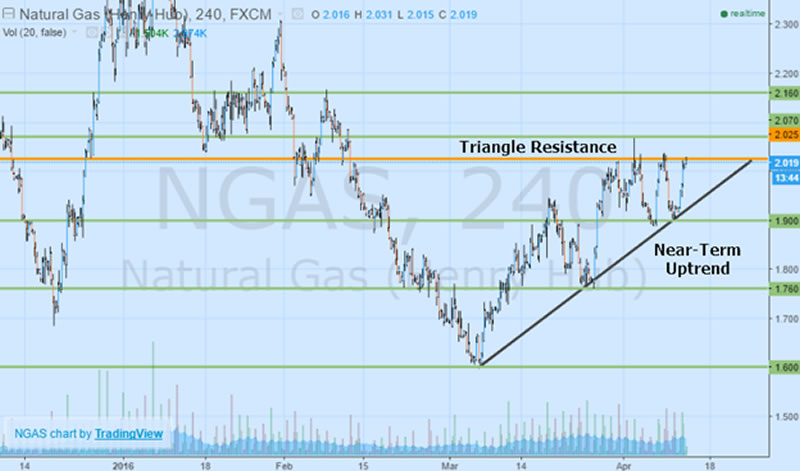
After touching multi-year lows back in March, crude oil prices remain on the rebound, currently consolidating in an ascending triangle pattern. The formation, which has a predominantly bullish bias, is based on the near-term uptrend line connecting the lows and horizontal resistance at sitting at $2.025 per MMBtu. A candlestick close above resistance would be indicative of a triangle-based breakout to be accompanied by renewed upside momentum targeting 2.070 before 2.160. If a candlestick close is necessary to confirm the breakout, with tests over the interim raising the possibility of a fake breakout move. However, should natural gas prices fall below the uptrend line, it suggests a breakdown in the pattern and potential reversal lower targeting support at 1.900 before possibly retesting lows near 1.600.

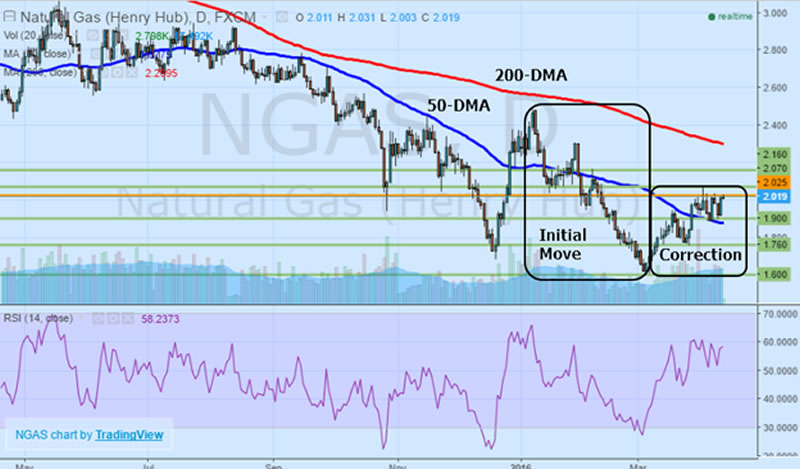
Over the medium-term, the 50-day moving averages trending below the price action in natural gas will continue to act as support, especially if the slope flattens and turns higher based on rising prices. However, from a purely technical perspective, the ongoing correction higher following the move lower from the 2016 peak reached back in January is indicative of an upside pullback that might have run its course after retracing the move lower by approximately 50%. Standard technical corrections are traditionally between 30-60% of the initial move. Considering the longer 200-day moving average is still trending lower above the price action, acting as resistance while the relative strength index inches closer to the overbought region, natural gas could very well be sitting on a critical point.

Conclusion
From a fundamental point of view, natural gas prices remain sensitive to weather related developments over the near-term despite the higher period of seasonal demand quickly wrapping up as the summer months approach. With inventory levels at seasonal records and production rising in tandem with prices, the supply side of the equation could be the driver of a reversal to the recent upside momentum. Even though near-term the bullish bias in prices will prevail if natural gas manages an ascending triangle breakout, longer-term, fundamental and technical conditions remain intact for further downside in prices..
Anyoption™ is the world's leading binary options trading platform. Founded in 2008, anyoption was the first financial trading platform that made it possible for anyone to invest and profit from the global stock market through trading binary options.
Our goal here at Market Oracle is to provide readers with valued insights and opinions on market events and the stories that surround them.
Website anyoption.com
© 2016 Copyright Anyoption - All Rights Reserved
Disclaimer: The above is a matter of opinion provided for general information purposes only and is not intended as investment advice. Information and analysis above are derived from sources and utilising methods believed to be reliable, but we cannot accept responsibility for any losses you may incur as a result of this analysis. Individuals should consult with their personal financial advisors.
© 2005-2022 http://www.MarketOracle.co.uk - The Market Oracle is a FREE Daily Financial Markets Analysis & Forecasting online publication.


