Is July 5th the Next Stock Market Bottom?
Stock-Markets / Stock Markets 2016 Apr 25, 2016 - 06:17 PM GMTBy: Brad_Gudgeon
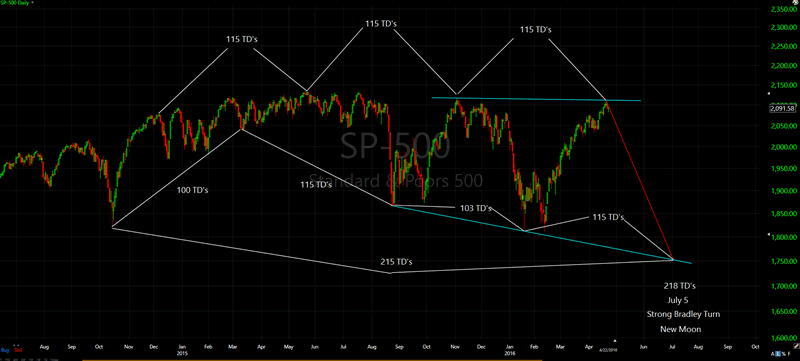
The chart below shows a repeating pattern of 115 trading day tops on the S&P 500 virtually shadowing the 100 trading day cycle to cycle lows. The 100 TD lows can run anywhere between 85 and 115 trading days. This low is commonly referred to as the 20-week low. The 20-week low is half of the dominant 9-month low that usually runs about 40 weeks .
Another useful tool is called the Bradley Siderograph. Also known as the Bradley, this tool uses planetary aspects to time important turns in the stock market. The two most important Bradley turns this year are July 5th and November 29th. Both fall on the new moon. Both also fall on the next two expected bottoms for the stock market in the year 2016 based on the past repeating cycles.

The dominant 9-month cycle occurred in October 2014 then August 2015. It is due in early July 2016, then again in April 2017 one month, which also coincides with the larger 8-year cycle bottom from March 2009.
In the next article, I will be investigating the Elliott Wave Pattern of the gold market along with the "Equality of Waves Principle" and see how it matches the Gann cycles and the Mercury Retrograde effect on the precious metals sector. I will also be touching on TLC (trend line convergence) cycle lows in GDX and how GDX has been running opposite gold as far as the dominant 16 trading day cycles are concerned. I will also be going over the IMP (Irregular Megaphone Pattern) again and the bearish implications for GDX (and gold) for the month of May. Hint: a more important top in gold and GDX is not yet in, but we are close.
Brad Gudgeon
Editor of The BluStar Market Timer
The BluStar Market Timer was rated #1 in the world by Timer Trac in 2014, competing with over 1600 market timers. This occurred despite what the author considered a very difficult year for him. Brad Gudgeon, editor and author of the BluStar Market Timer, is a market veteran of over 30 years. The website is www.blustarmarkettimer.info To view the details more clearly, you may visit our free chart look at www.blustarcharts.weebly.com Copyright 2015. All Rights Reserved
Copyright 2016, BluStar Market Timer. All rights reserved.
Disclaimer: The above information is not intended as investment advice. Market timers can and do make mistakes. The above analysis is believed to be reliable, but we cannot be responsible for losses should they occur as a result of using this information. This article is intended for educational purposes only. Past performance is never a guarantee of future performance.
Brad Gudgeon Archive |
© 2005-2022 http://www.MarketOracle.co.uk - The Market Oracle is a FREE Daily Financial Markets Analysis & Forecasting online publication.


