Gold Price Looking Vulnerable While Gold Stocks Correct
Commodities / Gold and Silver Stocks 2016 May 27, 2016 - 10:28 AM GMTBy: Jordan_Roy_Byrne
 Last week we highlighted our gold stocks bull analog chart which showed the gold stocks correcting at least 20% at this point during both the 2008-2009 and 2000-2001 recoveries. We concluded that gold stocks were likely to continue to correct in the days and weeks ahead. While that has played out so far, we should also note that Gold is suddenly looking more vulnerable.
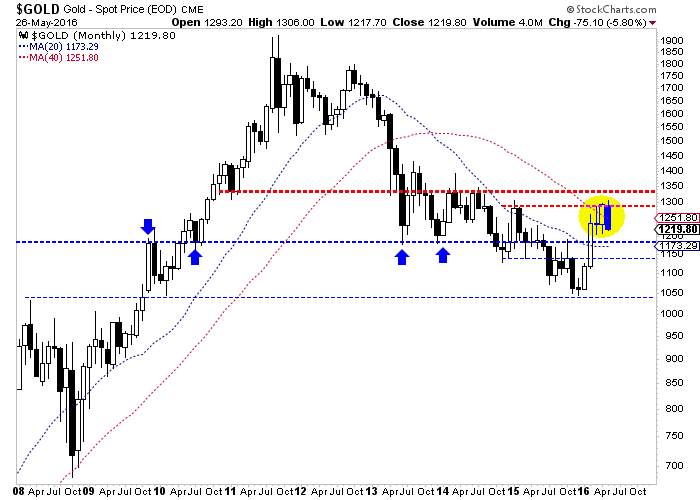
Unless Gold has a big bounce the next two days then its monthly chart will show a bearish engulfing candle for the month of May. That implies weakness in June. Key support levels are $1180 and $1140. The bearish reversal in May takes Gold back below its 40-month moving average at $1252. The 40-month moving average has been an excellent trend indicator for Gold throughout its history and it is the last line of defense for bears. They defended it, now bulls will need to defend $1180 and $1140.

Gold Monthly Candles
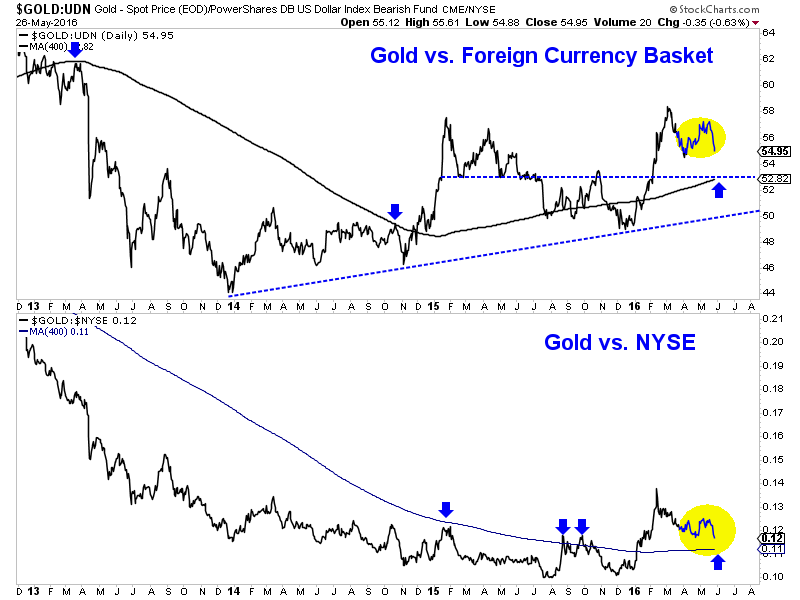
Equally as troubling for bulls, Gold has lost strength in real terms as it is acting poorly against foreign currencies (FC) and the equity market. Since Gold/FC touched a 3-year high in February it has undergone a sustained correction. Meanwhile, Gold/equities has already retraced most of its winter gains. Look for these ratios to continue lower and test their 400-day moving averages.

Meanwhile the miners have obviously begun a correction. GDX and GDXJ were already off 16% and 17% respectively at Wednesday’s lows. Even though the miners did not reach their 2014 resistance highs they still reached the second most overbought point in the past 20 years. GDX’s parent index, $GDM’s distance above its 100 and 200-day moving averages was the second greatest in the past 20 years. That leads us to believe that the correction is likely to be greater than the routine 20%.
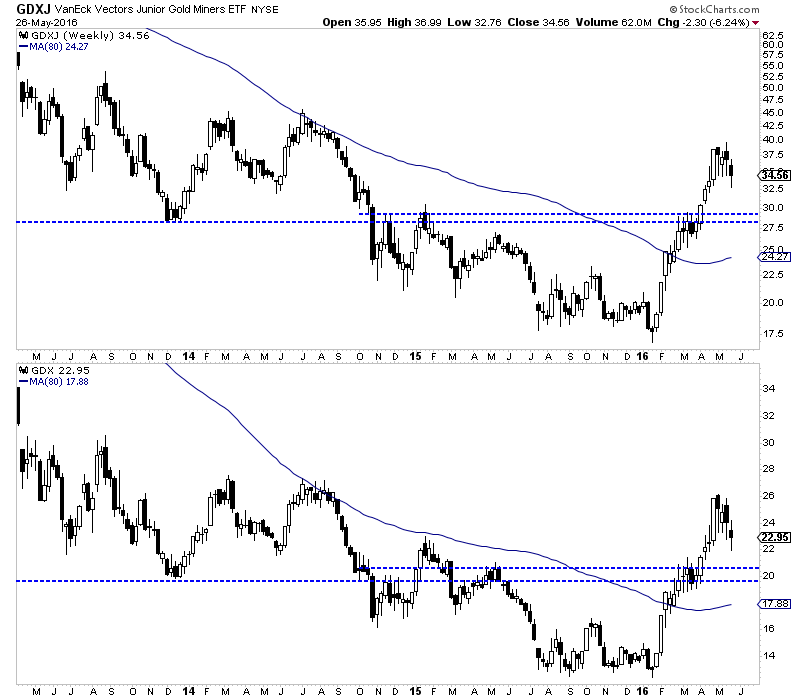
The weekly charts of GDX and GDXJ are shown below with the blue lines showing downside support targets. GDX should find good support around $20 while GDXJ should find support at or below $30. A move just below $20 equates to a 25% correction in GDX.

GDXJ & GDX Weekly Candles
The precious metals sector has begun a sizeable correction and it figures to continue into June. Gold needs to regain strength soon in real terms or it could undergo a deeper and longer retracement of its recent rebound than initially anticipated. We will continue to take first cues from the miners which should continue to lead the sector in the weeks and months ahead. Those who have been waiting for a buying opportunity could have their first chance in the weeks ahead.
Consider learning more about our premium service including our favorite junior miners which we expect to outperform in 2016.
Good Luck!
Bio: Jordan Roy-Byrne, CMT is a Chartered Market Technician, a member of the Market Technicians Association and from 2010-2014 an official contributor to the CME Group, the largest futures exchange in the world. He is the publisher and editor of TheDailyGold Premium, a publication which emphaszies market timing and stock selection for the sophisticated investor. Jordan's work has been featured in CNBC, Barrons, Financial Times Alphaville, and his editorials are regularly published in 321gold, Gold-Eagle, FinancialSense, GoldSeek, Kitco and Yahoo Finance. He is quoted regularly in Barrons. Jordan was a speaker at PDAC 2012, the largest mining conference in the world.
Jordan Roy-Byrne Archive |
© 2005-2022 http://www.MarketOracle.co.uk - The Market Oracle is a FREE Daily Financial Markets Analysis & Forecasting online publication.


