


Commodities Market Wrap - Gold, Silver, Crude Oil and Mining Stocks
Commodities / Financial Markets Mar 19, 2007 - 12:11 AM GMTBy: Douglas_V_Gnazzo

Iran's President Mahmoud Ahmadinejad asked to address the United Nations Security Council, reportedly causing speculators to assume that no reduction in Iranian oil supplies will occur for military or "diplomatic" reasons. Subsequently, crude oil fell to a six week low.
Prices are down 4.9% for the week, and are 10% lower compared to a year ago. Natural Gas fell 2.2% this past week.
Energy Secretary Samuel Bodman stated that the government plans on refilling the strategic oil reserve as early as April. The U.S. Energy Department plans to buy up to 4 million barrels of crude oil to replace 11 million barrels sold from the strategic petroleum reserve in the wake of Hurricane Katrina.
The replenishing rate is targeted to be 50,000 to 100,000 barrels a day. Bodman said at the time that the government would stop buying if its purchases caused prices to rise.
Perhaps I'm reading it wrong, however, how does 4 million barrels replace 11 million barrels? That amount (4 million) is less than half the amount (11 million) released after Katrina?
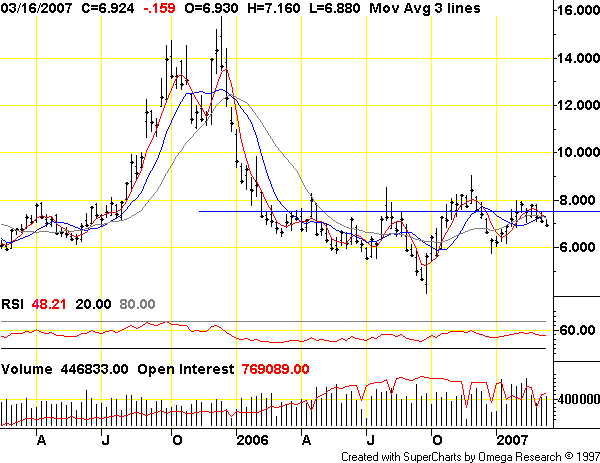
Below is the daily chart for West Texas Crude, which shows the recent rally to have been, at least so far - a counter-trend rally of the break below its previous rising channel.
Next up is the weekly chart for natural gas futures. The chart shows a fall of greater then 50% since the end of 2005, which was right AFTER Katrina.
Such timing does leave room to allow one to wonder about the precipitating cause of such extraordinary price action. Cui Bono?
Commodities
Overall commodities were down for the week, although some had stellar performances.
Copper prices were up 8.1% for the week, supposedly due to rising demand in China, the world's largest consumer of the metal.
Below is the CCI Commodity Index, which shows a loss for the week, but a definite uptrend from the lower left to the upper right hand corner of the chart in place: a bullish signature indeed.
Gold
For the week gold gained $1.90, closing at $653.90 (+ 0.29%). It closed at the highest daily close of the week, and the highest weekly close in the last 3 weeks. Intra-week it hit a high of $656.50 on Friday.
As the chart below shows, gold had a good break out back in late Jan. to Feb. It rallied to a high of $692.50 towards the end of Feb. Since then it has fallen to a low of $634.50, and presently sits at $653.90.
The horizontal resistance turned support, now turned back again into resistance, at $655-656 - is the line drawn in the sand that gold needs to break above, and stay above; if any sustainable rally is going to occur.
It has its work cut out for it - but gold has lasted through wars, famines, pestilence, and the ages of time - it remains immutable, the ultimate store of wealth. When gold speaks - all tongues remain silent.
Next we have chart of streetTracks gold ETF.
The chart reveals GLD testing its lower trend line going back to Oct.of 2006. So far - so good. If a higher low is kept in place, then a sustainable rally should follow.
Stochastic indicator is turning up from oversold territory with a bullish cross over occurring. The POG is above its 50 ma. We wait with interest to see what the new week brings.
Below is the point and figure chart for gold, based on percentage, not the standard p&f chart. The chart shows a very bullish price projection.
The standard point & figure chart shows a bearish price projection of $585.00.
Silver
Silver closed the week out at $13.22 up 0.24 or +1.89%. It was silver's daily high for the week, and the highest weekly close in 3 weeks. Intra-week silver had an inter-daily high of $13.27.
Silver has still been performing better then gold. The chart below shows silver bumping up against significant overhead resistance. It's time to either break on through to the other side - or retest its lower trend line. We'll go with Morrison.
Next is the central fund of Canada. RSI is turning up, and it looks like a positive MACD crossover is about to occur. Histograms are shrinking back towards zero.
Higher lows have been kept in place; however, as the highlighted area indicates - there is significant overhead resistance or supply, which needs to be worked off before a sustainable rally can occur.
XAU Index
The XAU Index gained 1.27 points to close the week at 133.31 (+0.96%). It was not the week's daily high, which was made on Monday at 133.77.
It was, however, the highest weekly close in 3 months, although there were several higher intra-weekly highs that were made during that same time period.
The chart below shows the stochastic indicator headed up from oversold levels with a positive crossover.
Recently, the gold/xau ratio hit an extremely oversold reading of 5.00, and has since backed off to 4.91. These are very oversold levels, which generally coincide with the beginning stages of rallies.
One thing we do not like on the chart is that the Bollinger Bands are getting wider apart. Presently, the XAU is headed for the middle of the BB at 136.55. There is a good deal of overhead resistance to overcome, and the index has its work cut out for it.
HUI Index
The HUI Index was down -1.33 for the week, closing at 327.01 (-0.37%). It did not close on its high for the week - that was made on Monday at 331.62.
The daily chart shows the Hui has a good deal of overhead resistance to work through. Just by the looks of it - it appears that it will take a few more weeks to get through, however, the gold & silver stocks are thinly traded stocks, and can move quite quickly and strongly on short notice. It doesn't take huge sums to move the gold stocks significantly.
The weekly chart illustrates that the HUI has been in a trading range since March of 2006 - over a year now. On the top of the range sits 401.69 and at the bottom sits 270.00.
The middle of the range is about 285.00. Presently the index is at 327, well above its 65 week ema.
Up next is the monthly chart of the Hui Index. It shows the index just approaching its bottom trend line. A series of higher lows have been kept intact thus far.
However, MACD has recently made a negative downside cross over, and the histograms are accelerating to the downside.
Gold & Silver Stocks
The first up is Agnico Eagle Mines (AEM). We have owned this stock before, and it is one of the best performing of all pm stocks.
RSI shows a positive divergence, and the MACD appears about to put in a positive upward cross over. Histograms are receding towards zero.
There is significant resistance at $38. We are watching for a break above 38, and then waiting for a subsequent correction that holds above that level.
Last up is Hecla Mining. Hecla has also been one of the best performing pm stocks. We recently sold it to book profits, and we are pleased to have been able to do so.
Presently, there are mixed signals as to which way HL is going to go. MACD is very close to either making a positive cross over up, or a negative cross over down. Histograms have just turned negative. For now we wait and watch.
Douglas V. Gnazzo
Honest Money Gold & Silver Report
Douglas V. Gnazzo is the retired CEO of New England Renovation LLC, a historical restoration contractor that specialized in the restoration of older buildings and vintage historic landmarks. Mr. Gnazzo writes for numerous websites, and his work appears both here and abroad. Just recently, he was honored by being chosen as a Foundation Scholar for the Foundation of Monetary Education (FAME).
Disclaimer: The contents of this article represent the opinions of Douglas V. Gnazzo. Nothing contained herein is intended as investment advice or recommendations for specific investment decisions, and you should not rely on it as such. Douglas V. Gnazzo is not a registered investment advisor. Information and analysis above are derived from sources and using methods believed to be reliable, but Douglas. V. Gnazzo cannot accept responsibility for any trading losses you may incur as a result of your reliance on this analysis and will not be held liable for the consequence of reliance upon any opinion or statement contained herein or any omission. Individuals should consult with their broker and personal financial advisors before engaging in any trading activities. Do your own due diligence regarding personal investment decisions. This article may contain information that is confidential and/or protected by law. The purpose of this article is intended to be used as an educational discussion of the issues involved. Douglas V. Gnazzo is not a lawyer or a legal scholar. Information and analysis derived from the quoted sources are believed to be reliable and are offered in good faith. Only a highly trained and certified and registered legal professional should be regarded as an authority on the issues involved; and all those seeking such an authoritative opinion should do their own due diligence and seek out the advice of a legal professional. Lastly, Douglas V. Gnazzo believes that The United States of America is the greatest country on Earth, but that it can yet become greater. This article is written to help facilitate that greater becoming. God Bless America.
© 2005-2022 http://www.MarketOracle.co.uk - The Market Oracle is a FREE Daily Financial Markets Analysis & Forecasting online publication.