


Confluent Trading
InvestorEducation / Learn to Trade Jun 08, 2016 - 03:28 PM GMTBy: Submissions
 Chris Drinkwater writes: In nature I seem to recall from some dim, distant geography lesson a confluence is where two rivers meet. In trading it is the meeting of 2 or more points of support or resistance, the more the merrier.
Let's take a look at this gbp/usd 4 hour chart. We can see quite clearly that this has been in a downtrend for a while, then we get this sudden bullish movement at A.
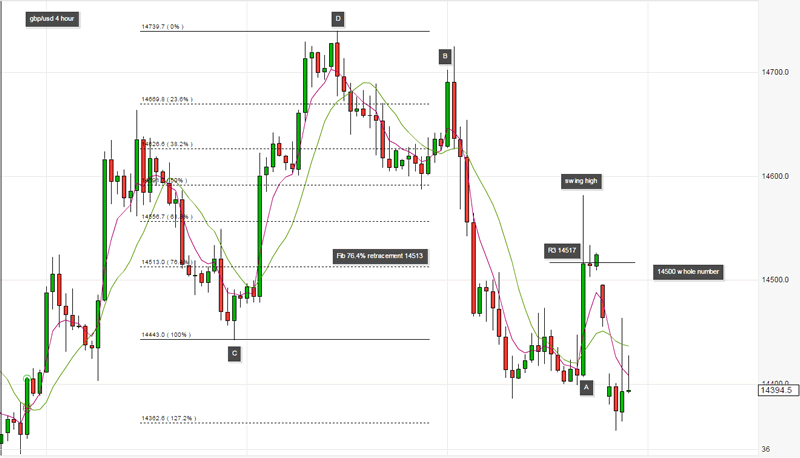
At this point we need to ask ourselves, is this a natural retracement of price like we experienced at B where the price continued downward or is this beginning of a period of consolidation or even the start of a new movement upwards? What can we do to answer these questions?
We can begin to look for obvious areas of confluence around the same price level.
The first thing to do is make a Fibonacci drawing of the most recent swing, in this case it is the recent bullish move from C to D. Once this is drawn we can see that this candle nearly touched the halfway mark and closed at 14517 very close to the Fibonacci level of 76.4% at 14513
We can also see that the R3 pivot line that day also printed at 14517, add to this the whole number lurking at 14500 and you can see that we have a very strong confluent set up.
That I think would be enough to convince me to go short but on this charts the gifts keep coming!
Candle A has now formed a perfect swing high ( a high sandwiched between two lower highs either side) This is a classic price action sell signal in a downtrend.
I incorporate confluent trading in every trade I take I believe it is one of those things you can easily do to improve your 'edge'
Areas For Confluent Support and Resistance
Moving average lines
Pivot lines
Key areas of support and resistance
Consolidation break outs
Fibonacci levels
Prior day high / low
Whole numbers
I incorporate confluent trading in every trade I take I believe it is one of those things you can easily do to improve your 'edge' and the more you do it the better will be your confidence, your discipline and your consistency.
Chris Drinkwater
www.Animusfx.com
I am a successful Day / Swing Trader and Partner in a local business in the South West of the UK.
I have been trading now for 10 years and in that time have accumulated a huge amount of screen time and experience, with many thousands of trades taken in that time.
I am acutely aware how difficult it is for anyone starting out in this trading business and how much information in the public domain is inaccurate, out of date or just plain wrong.
We started our website with the intention of educating newcomers and giving them the tools they need to increase their confidence, consistency and discipline in trading.
We now have over 250 students in 49 countries across the world and we are growing fast!
© 2016 Chris Drinkwater - All Rights Reserved
Disclaimer: The above is a matter of opinion provided for general information purposes only and is not intended as investment advice. Information and analysis above are derived from sources and utilising methods believed to be reliable, but we cannot accept responsibility for any losses you may incur as a result of this analysis. Individuals should consult with their personal financial advisors.
© 2005-2022 http://www.MarketOracle.co.uk - The Market Oracle is a FREE Daily Financial Markets Analysis & Forecasting online publication.