Gold Bullion and Stocks Flashing Seasonal Buy Signals
Commodities / Gold & Silver Jul 21, 2008 - 04:06 PM GMTBy: Peter_Degraaf

 Gold and Silver Stocks of the HUI index, past and present, as well as future expectations. This essay looks at the seasonal lows for the HUI index, and examines the rise that followed this low, for the past 9 cycles (1999 – 2008). This study should give us a good idea for future expectations, regarding the remainder of 2008. “As the HUI goes, so goes the gold price”.
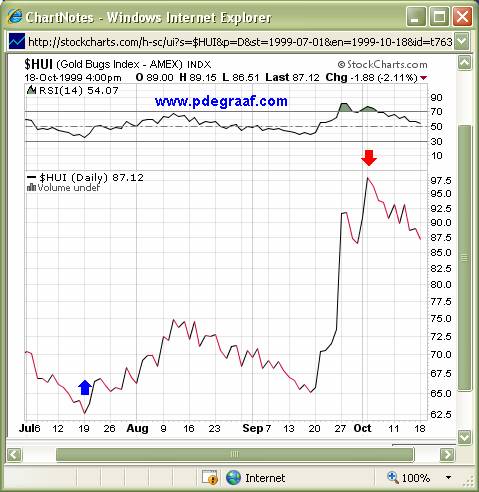
Featured is the HUI index cycle bottom (blue arrow), of July 19 th 1999 . The HUI subsequently rose 56% by early October (red arrow).
The cycle bottom the following year (2000) occurred in early August and rose until December for a gain of 11%
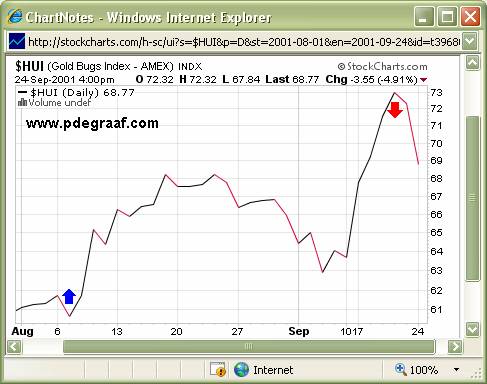
Featured is the HUI index as it carved out its seasonal low in early August of 2001 at 60.6, and then rose to 73 by mid September, for a rise of 20%.
In 2002, the HUI made its seasonal low in July at 95, and rose to 138 by mid September, for an increase of 45%.
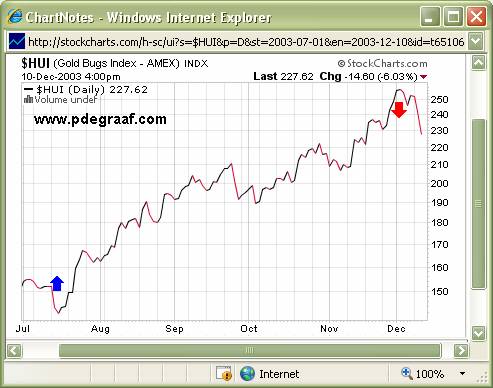
Featured is the 2003 HUI index cycle low in mid-July at 142 followed by a run that took HUI up 80% to 256 by early December.
In 2004 the HUI put in a seasonal low in early August at 177. It then rose until November, registering 245, for a gain of 38%.
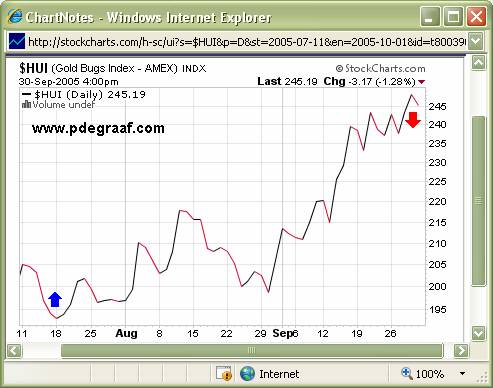
Featured is the HUI chart focusing on the seasonal low for 2005 which occurred on July 18 th at 193. The index then rose to 248 in September, for a gain of 28%.
The HUI index for 2006 bottomed in June at 272, then rose until September where it topped out at 366 for a gain of 35%.
The HUI index for 2007 bottomed at its seasonal bottom in August of 2007 at 300, then rose until November, where it topped out at 448, for a gain of 49%.
====================================================-
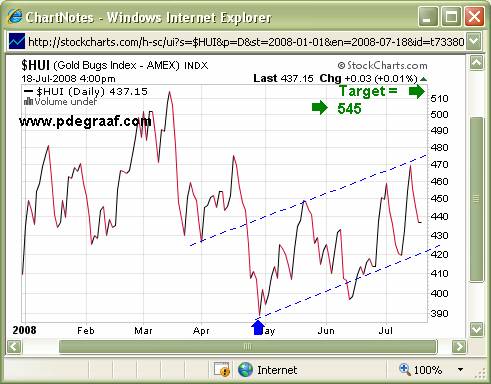
Featured is the HUI index for 2008. The seasonal low occurred late April at 390 (blue arrow). Already the index has risen 20%, but the trend is decidedly ‘up' (dashed blue lines), and the average rise for the past 9 years from cycle low to follow-up peak, has been +40%. Thus if the HUI simply matches the average rise, the target for this cycle move will be at 545. The possibility exists (due to very bullish fundamentals that did not exist in prior years), that the HUI will rise above the 9 year average. If it matches the performance of 2003, then the target between now and the end of the year will be 700 (almost doubling its starting point). If it should better the 2003 performance, then ‘the sky will be the limit'.
We end this essay with the gold bullion daily bar chart.
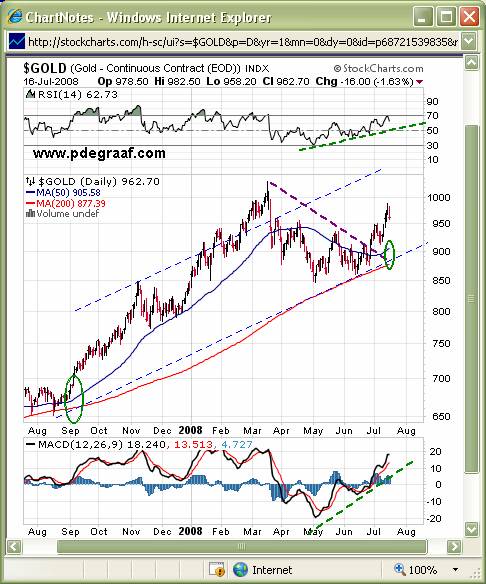
Featured is the daily bar chart for gold bullion. The blue lines highlight the current channel within which the gold price is rising. The purple line shows the resistance that built up since gold became temporarily overpriced in March. The breakout from beneath that resistance occurred in late June (and was the subject of our last article), and this breakout has since been successfully tested. The green ovals show the symmetry of the positive relationship between the rising 50DMA and the 200DMA, an indication of a bull market in progress. The green lines at top and bottom of this chart, point to the fact that the supporting indicators are positive.
My Gold Direction Indicator is flashing a BUY SIGNAL today, July 21 st !
While we should not expect price to go straight up, it is nevertheless a reasonable expectation that gold will continue to rise within this channel, (currently rising at a rate of 2.8% per month). The main driving force for a rising gold price is not the banking crisis, nor the high oil price (although they help); the main force is ‘negative real interest rates', (T-bill rate less C.P.I.). The Fed admits to real rates at -2%, but the actual real rate is probably around -6% or even lower. Historically, whenever real rates are negative (as now) - gold will rise. Price inflation is now virtually a world-wide phenomenon, and shows no signs of abating anytime soon. This guarantees that real rates will stay negative for many months, even years, as interest rates will play ‘catch-up' (while central banks tighten the screws), but are not likely to move ahead of the curve.
For gold bulls there is yet a pleasant surprise waiting in the wings. The commercial traders and the bullion banks that are ‘net short', totally missed out on lightening their exposure during the recent bottom. According to MIDAS ( www.gata.org ) one bank, Goldman Sachs, operating on the TOCOM exchange in Tokyo is currently short 5,900 gold contracts, and this financial institution hardly made any changes in its exposure during the opportunity offered up in June. The commercial traders, including bullion banks, are net short over 220,000 contracts. At some point these shorts will have to be covered. The majority of these short positions are losing money!
By Peter Degraaf.
Peter Degraaf is an on-line stock trader, with over 50 years of investing experience. He issues a weekly alert to his subscribers. For a 60 day free trial, send him an E-mail itiswell@cogeco.net , or visit his website www.pdegraaf.com
DISCLAIMER: Please do your own due diligence. I am NOT responsible for your trading decisions.
Peter Degraaf Archive |
© 2005-2022 http://www.MarketOracle.co.uk - The Market Oracle is a FREE Daily Financial Markets Analysis & Forecasting online publication.


