


Bollinger Band Trading Strategy
InvestorEducation / Trading Systems Jun 15, 2016 - 06:24 PM GMTBy: Chris_Drinkwater

 John Bollinger developed what was to become known as Bollinger Bands as a useful measurement of volatility. It is I think unnecessary to go into the maths of the Bollinger Band as they can be found on every trading platform.
As John Bollinger himself noted low volatility begets high volatility so it is useful to have a graphic representation of low volatility so that we can look for our entry in that area to take advantage of the high volatility that must come.
The standard setting are a 20 look back period and 2 standard deviations apart around a simple moving average. This setting is fine for longer term trades but if you are e day or swing trading then change the look back period to 11 and leave the standard deviation as they are at 2.
Notice the constriction in the bands where the arrows are, like someone has squeezed a sausage!
This is the area of low volatility and you can see the high volatility that follows, that's what we want, we don't want to be waiting for an age for the action to unfold.
Here then we have a simple strategy to trade.
Bollinger Band Strategy
1) Wait for an area of low volatility
2) Wait for the candle to close over the simple moving average. - black line
3) Wait for the price to retrace to the simple moving average. - black line
4) Enter
5) Stop loss for a short trade. The top of the candle that crossed the line.
6) Stop loss for a long trade. The bottom of the candle that crossed the line.
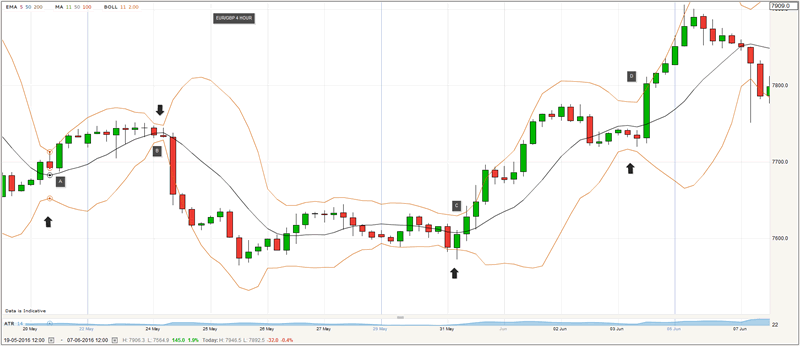
Let's take a look at how it pans out.
At (A) the green candle closes over and then retraces 2 candles later to touch the line.
At (B) There is a tiny candle that closes under the line and the next one opens on the line, that's a touch and so it's a go at that point.
At (C) same thing it opens touching the line.
At (D) This is a very large candle so it's not surprising that is does not retrace, you can't win them all!
I hope you enjoyed this article. the Bollinger Band strategy can be very profitable!
Chris Drinkwater
www.Animusfx.com
I am a successful Day / Swing Trader and Partner in a local business in the South West of the UK.
I have been trading now for 10 years and in that time have accumulated a huge amount of screen time and experience, with many thousands of trades taken in that time.
I am acutely aware how difficult it is for anyone starting out in this trading business and how much information in the public domain is inaccurate, out of date or just plain wrong.
We started our website with the intention of educating newcomers and giving them the tools they need to increase their confidence, consistency and discipline in trading.
We now have over 250 students in 49 countries across the world and we are growing fast!
© 2016 Chris Drinkwater - All Rights Reserved
Disclaimer: The above is a matter of opinion provided for general information purposes only and is not intended as investment advice. Information and analysis above are derived from sources and utilising methods believed to be reliable, but we cannot accept responsibility for any losses you may incur as a result of this analysis. Individuals should consult with their personal financial advisors.
© 2005-2022 http://www.MarketOracle.co.uk - The Market Oracle is a FREE Daily Financial Markets Analysis & Forecasting online publication.