


Crude Oil Price - Oil Bears vs. Support Zone
Commodities / Crude Oil Jun 16, 2016 - 06:42 AM GMTBy: Nadia_Simmons

 Trading position (short-term; our opinion): No positions are justified from the risk/reward perspective.
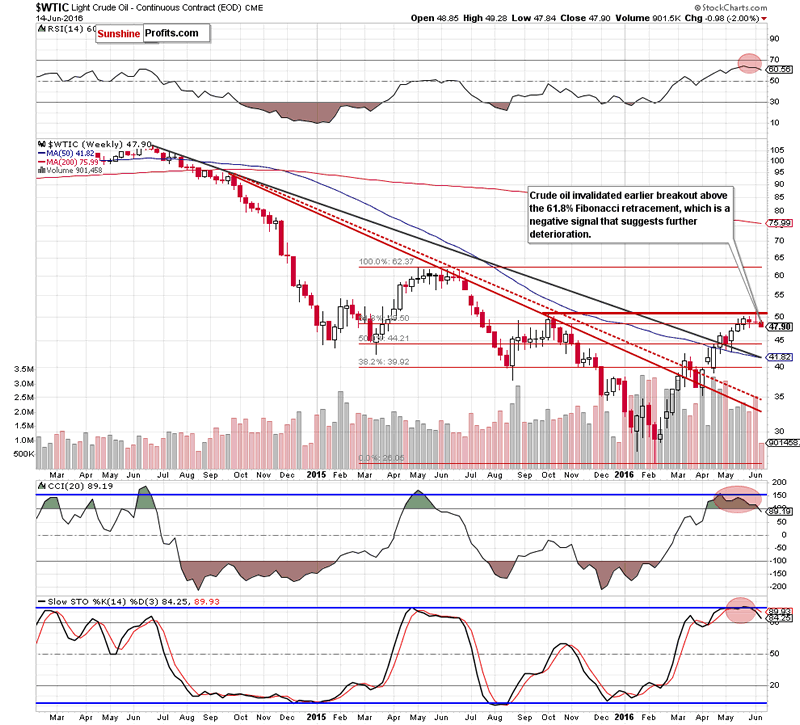
On Tuesday, crude oil lost 1.36% as rising uncertainty around Brexit weighed on investors' sentiment (leaving the European Union by Britain could trigger a recession and slow demand for crude in Europe). In these circumstances, light crude declined under the short-term support line and approached the Jun lows. Will we see lower prices in the coming days?
Let's examine charts below and find out what can we infer from them about future moves (charts courtesy of http://stockcharts.com).
On Monday, we wrote:
(...) the commodity increased slightly above the Oct high, but then moved lower and invalidated earlier breakout. This negative signal encouraged oil bears to act, which resulted in a drop under the barrier of $50. Additionally, the Stochastic Oscillator generated a sell signal, while the CCI is very close to doing the same, which suggests further deterioration in the coming week.
Looking at the above chart, we see that the situation developed in line with the above scenario and light crude extended losses.
What impact did this drop have on the very short-term chart? Let's examine the daily chart and find out.

Quoting our Monday's alert:
(...) crude oil extended losses, closing the day under the barrier of $50 and invalidating earlier breakout above it, which is a negative signal, which suggests a drop to the blue support line based on the late May and Jun lows. If it is broken, oil bears will test the green support zone created by the late-May and Jun lows (around $47.40-$47.75) in the coming day(s).
On the daily chart, we see that oil bears pushed the commodity lower as we had expected, which resulted in a drop to the green support zone. What's next? Taking into account sell signals generated by the indicators, we think that light crude will move lower once again and test the late-May low of $47.40 or even the Apr high of $46.78 in the coming day(s). If the commodity closes the day under these supports, we'll consider opening short positions.
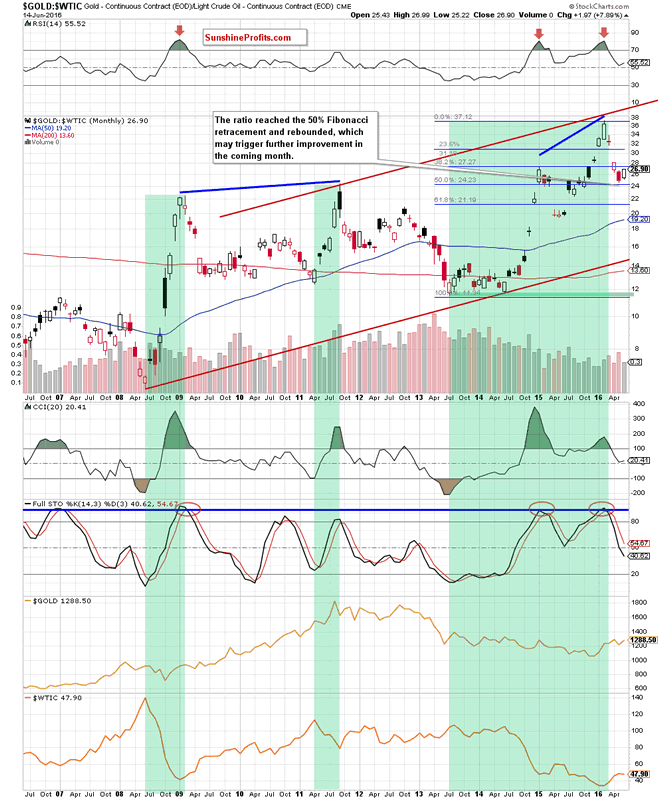
Having said the above, let's take a closer look at the gold-to-oil ratio and look for more clues about future moves.
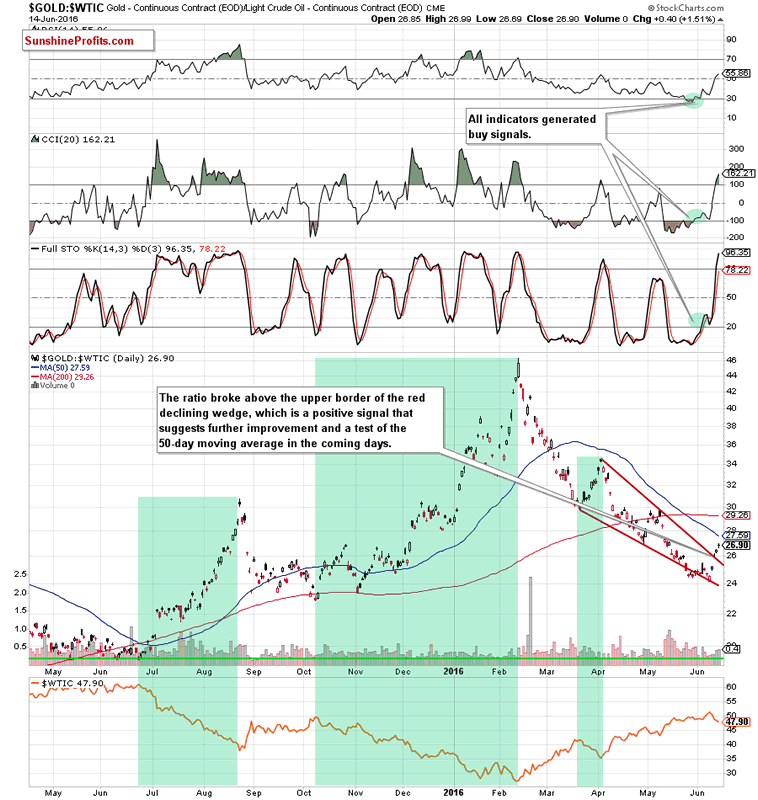
On Monday, we wrote the following:
(...) the ratio invalidated earlier small breakdown under the lower border of the red declining wedge (seen on the daily chart), which resulted in further improvement and a breakout above the upper border of the formation, which is a very positive signal - especially when we factor in buy signals generated by all daily indicators.
As you see on the daily chart, the breakout above the upper border of the red declining wedge triggered further improvement, which suggests that we'll see a test of the 50-day moving average in the coming day(s).
What does it mean for crude oil? As you see on the above charts, may times in the past higher values of the ratio have corresponded to lower prices of light crude. We have seen this strong negative correlation in the second half of Jun 2008, between Apr and Sep 2011 and also between Jul 2013 and Feb 2016 (we marked all these periods with green), which suggests that another move to the upside on the above chart will translate into lower values of crude oil in the coming days.
Summing up, crude oil extended losses and closed the day under the blue support line, which suggests a test of the late May low of $47.40 or even the Apr high of $46.78 in the coming day(s). If the commodity closes on of the following days under these supports, we'll consider opening short positions.
Very short-term outlook: mixed with bearish bias
Short-term outlook: mixed with bearish bias
MT outlook: mixed
LT outlook: mixed
Trading position (short-term; our opinion): No positions are justified from the risk/reward perspective.
Thank you.
Nadia Simmons
Forex & Oil Trading Strategist
Przemyslaw Radomski
Founder, Editor-in-chief
Sunshine Profits: Gold & Silver, Forex, Bitcoin, Crude Oil & Stocks
Stay updated: sign up for our free mailing list today
* * * * *
Disclaimer
All essays, research and information found above represent analyses and opinions of Nadia Simmons and Sunshine Profits' associates only. As such, it may prove wrong and be a subject to change without notice. Opinions and analyses were based on data available to authors of respective essays at the time of writing. Although the information provided above is based on careful research and sources that are believed to be accurate, Nadia Simmons and his associates do not guarantee the accuracy or thoroughness of the data or information reported. The opinions published above are neither an offer nor a recommendation to purchase or sell any securities. Nadia Simmons is not a Registered Securities Advisor. By reading Nadia Simmons’ reports you fully agree that he will not be held responsible or liable for any decisions you make regarding any information provided in these reports. Investing, trading and speculation in any financial markets may involve high risk of loss. Nadia Simmons, Sunshine Profits' employees and affiliates as well as members of their families may have a short or long position in any securities, including those mentioned in any of the reports or essays, and may make additional purchases and/or sales of those securities without notice.
© 2005-2022 http://www.MarketOracle.co.uk - The Market Oracle is a FREE Daily Financial Markets Analysis & Forecasting online publication.