Silver Price Will Move Much Higher And Faster Than Most People Think
Commodities / Gold and Silver 2016 Jul 05, 2016 - 02:53 PM GMTBy: Hubert_Moolman
Historically, the silver price has a tendency to decline and rise way more and faster than most people expect. The recent 5-year decline is a good example of a decline that went lower than expected. There are good reasons for this, but we often miss it due to our focus on the now instead of the bigger picture.
Based on the bigger picture for silver, the current silver price rally will also likely far exceed most people’s expectation. There are many fundamental and technical reasons that give this silver price rally and edge above all other previous rallies. I have written about this on various occasions (here is one example).
These fundamental and technical reason can often be best explained by way of fractal analysis. Here, I would like to point out a few of these reasons.
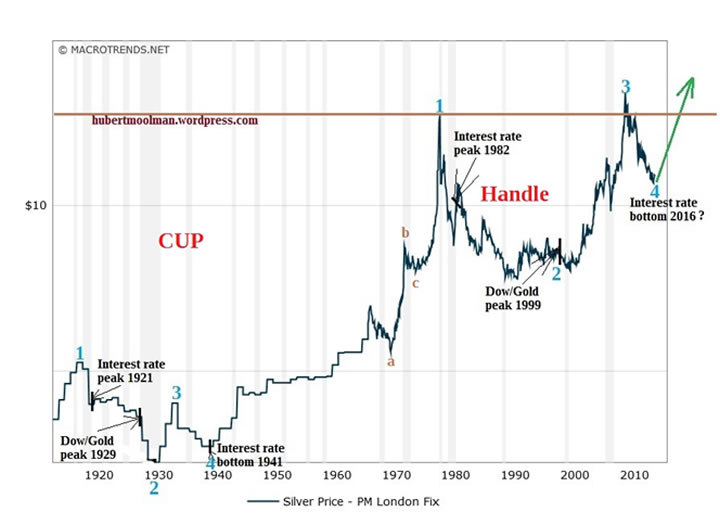
Below is a long-term chart of silver (from macrotrends.net):

On the chart, I have marked two fractals (1 to 4), to show how the period from 1921 to 1941 is similar to 1980 to 2016, for the silver market. The two fractals exist in similar conditions relative to interest rate (yearly) peaks and bottoms, as well the Dow/Gold ratio peaks.
We appear to be around point 4, the point where silver and eventually interest rates are likely to rise significantly, like it did from around 1941. However, the speed of the increase is likely to exceed the historical one by a large margin.
This is due to the difference of where these two patterns exist within the larger pattern (the big picture almost everyone ignores). The larger pattern (as a whole) takes the form of a cup and handle-type pattern (or even a flag/pennant-type formation). The older pattern exists before the handle (at the bottom of the large cup), whereas the current pattern exist at the end of the handle.
The older pattern existed during a period of consolidation or building, whereas the latest pattern will conclude at the explosive stage of the pattern (just after the handle, where the impulse move happens). This means that the conclusion of the current pattern (from point 4 to an eventual top) will occur within a fraction of the time of the conclusion of the older pattern.
If you accept the larger pattern as a cup and handle-type pattern, then the expected target, based on the standard movement of such a pattern, is almost unbelievable in this case. The movement from the bottom of the cup in 1932, was from $0.28 to $50 in 1980 (the chart is a little distorted since it shows a lower top in 1980). This is a 178.57 (50/0.28) fold increase. Therefore, the target for this larger pattern would be a similar move from the $50 level. So, that would be $50 x 178.57 = $8 928.
Although this target might seem ridiculous now, it is still very much possible. Especially, considering that someone in 1932 would also have thought it impossible that silver would reach $50. However, I do not think that this “fight” will go the distance because we are likely to have a knockout (total collapse) or technical knockout (reset) before this pattern concludes.
For more of this kind of analysis on silver and gold, you are welcome to subscribe to my premium service. I have also recently completed a Long-term Silver Fractal Analysis Report .
Warm regards
Hubert
“And it shall come to pass, that whosoever shall call on the name of the Lord shall be saved”
http://hubertmoolman.wordpress.com/
You can email any comments to hubert@hgmandassociates.co.za
© 2016 Copyright Hubert Moolman - All Rights Reserved
Disclaimer: The above is a matter of opinion provided for general information purposes only and is not intended as investment advice. Information and analysis above are derived from sources and utilising methods believed to be reliable, but we cannot accept responsibility for any losses you may incur as a result of this analysis. Individuals should consult with their personal financial advisors.
© 2005-2022 http://www.MarketOracle.co.uk - The Market Oracle is a FREE Daily Financial Markets Analysis & Forecasting online publication.


