


Get Gold At $356 Per Oz By Buying Silver Today
Commodities / Gold and Silver 2016 Jul 07, 2016 - 12:55 PM GMTBy: Hubert_Moolman

 Gold is currently trading at around $1 370 an ounce. I like gold, but for me that is too expensive, even although I think it will increase significantly over the next couple of years.
Why do I think it is too expensive? Because I think there is a way of getting it at the equivalent of $345 an ounce, by buying silver instead.
In January 1980, silver and gold reached all-time high prices (at that time) of $50 and $850 respectively. Therefore, the Gold/Silver ratio at that time was about 17 (850/50).
Silver is currently trading at around $20.30 per ounce. This is about 40.6% (20.3/50) of its 1980 all-time high price. If, I was buying gold at 40.6% of its 1980 high, then I would pay about $345 (850x0.406).
So, if I buy $345 worth of silver [17 ounces (345/20.31)], and hold it until the Gold/Silver ratio reaches the 17-level again; I can exchange it for 1 ounce of gold. I would effectively have paid only $345 for 1 ounce of gold, which today cost $1370.
In my opinion, based on the historical relationship between gold and silver, it is almost guaranteed that the Gold/Silver ratio will again reach the 17- level. Therefore, I believe it is almost guaranteed that this strategy will work. The only question is, how long will it take? Especially since it only was that low more than 30 years ago.
The current state of the Gold/Silver ratio seems to suggest that I might not wait very long.
Below, is a 100-yr chart of the Gold/Silver ratio:
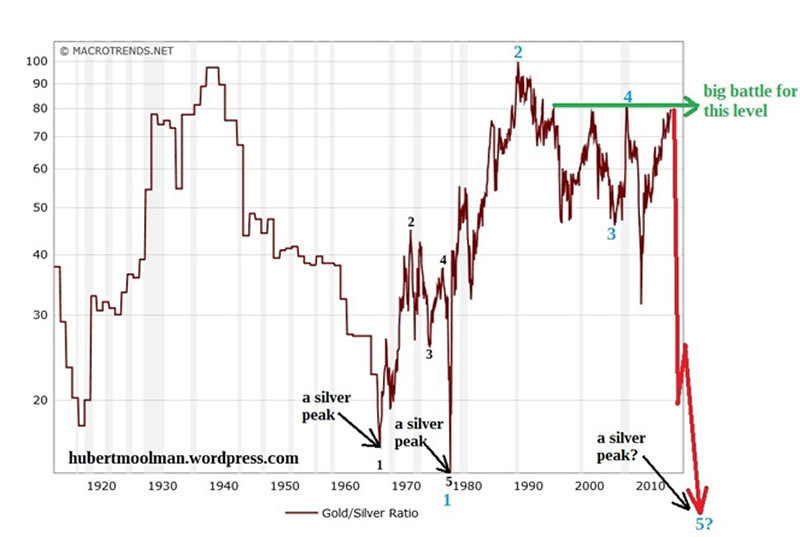
On the chart, I have marked a 70s pattern with black points 1 to 5, and compared it to the latest pattern, which I have marked with blue points 1 to 5. Both patterns start at a peak in the silver price (1968 and 1980 silver peaks, respectively). The older pattern bottomed at a major silver peak; therefore, the current pattern could end at a major silver peak.
If the current fractal completes like the 70s pattern (stay consistent), then point 5 (on the current pattern) should be lower than a Gold/Silver ratio of 17 (the level of the Gold/Silver ratio at point 5 in 1980). So, this suggests that it is likely that I can complete my strategy of getting an ounce of gold for $345.
A completion of the current pattern as suggested is consistent with the bullish fundamentals of silver (and gold)and will likely bring much higher prices in the near future. The ratio has already started collapsing since I did this chart originally (from about 80 to 67).
The current pattern is bigger than the 70s pattern, so the current move to point 5 will take longer. However, I don’t think that I will have to wait longer than 2019, before the ratio hits the 17-level.
For more of this kind of analysis on silver and gold, you are welcome to subscribe to my premium service. I have also recently completed a Long-term Silver Fractal Analysis Report .
Warm regards
Hubert
“And it shall come to pass, that whosoever shall call on the name of the Lord shall be saved”
http://hubertmoolman.wordpress.com/
You can email any comments to hubert@hgmandassociates.co.za
© 2016 Copyright Hubert Moolman - All Rights Reserved
Disclaimer: The above is a matter of opinion provided for general information purposes only and is not intended as investment advice. Information and analysis above are derived from sources and utilising methods believed to be reliable, but we cannot accept responsibility for any losses you may incur as a result of this analysis. Individuals should consult with their personal financial advisors.
© 2005-2022 http://www.MarketOracle.co.uk - The Market Oracle is a FREE Daily Financial Markets Analysis & Forecasting online publication.