


Not Everything Is Bullish for Gold
Commodities / Gold and Silver 2016 Jul 21, 2016 - 06:39 PM GMTBy: P_Radomski_CFA

 There are quite a few bearish indications that suggest lower precious metals prices are just around the corner. Let's take a look at a few of them (charts courtesy of http://stockcharts.com).
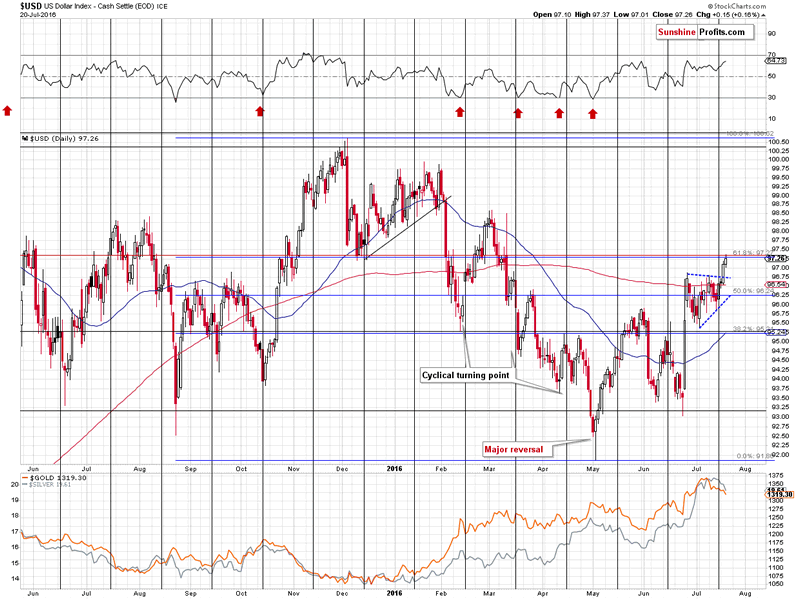
First of all, the USD Index broke above the triangle consolidation pattern and the breakout is almost confirmed (or confirmed, depending on the approach - some suggest waiting for 2 closes above a certain level and some prefer 3 closes; in the case of the precious metals market we found the 3-day rule to be more useful, but it's not as clear in the case of currency markets). That's bearish news for the precious metals sector, because (with local exceptions, like the Brexit vote) PMs tend to move in the opposite way to the USD Index.
In yesterday's alert we wrote the following:
(...) The USD has been consolidating for about 3 weeks - definitely enough to cool down the previous - post-Brexit-vote emotions, so the consolidation can end any day now - perhaps even later today as only a little additional move higher is necessary.
The cyclical turning point was last Friday and the USD Index indeed turned around and rallied on this day, thus increasing the odds for a rally's continuation.
The implications for the USD Index are bullish as the move that follows a breakout tends to be similar (mostly in terms of price, but often also in terms of time) to the moves that preceded the consolidation. The move that preceded the consolidation this time was a rally from about 93 to about 96.5 - a 3.5 move. Starting an analogous move from the bottom of the triangle pattern (about 95.5 in early July) provides 99 as the next target.
Consequently, the implications of the current situation are bullish for the USD Index and bearish for the precious metals sector (which tends to move in the opposite way to the U.S. dollar; the Brexit case was an exception from this rule) and they will be much more bullish (USD) and bearish (precious metals) in case the breakout above the triangle pattern is confirmed.
Let's keep in mind that 99 is only an initial target.
The USD Index indeed broke higher and closed visibly above the 97 level - clearly above the mentioned resistance at 96.75.
Now, the breakout didn't result in a big plunge in the precious metals sector, but the reason could be that the breakout is not confirmed yet - the move is seen as something temporary by traders and investors. Consequently, it could simply be the case that the metals' and miners' reaction is delayed, not absent.
A few hours after writing the above gold and silver indeed plunged - most likely as traders started viewing the breakout in the USD Index as confirmed. At the moment of writing these words, the USD remains above 96.75 (it moved to 96.88, though), so the breakout was not invalidated.
The upper border of the triangle consolidation pattern is not the only resistance that's in play, though. The USD Index moved to the 61.8% Fibonacci retracement based on the December - May decline, which is also an important resistance level. Consequently, a day or a few days of consolidation will not be surprising. Still, 99 remains to be the initial upside target for the USD Index.
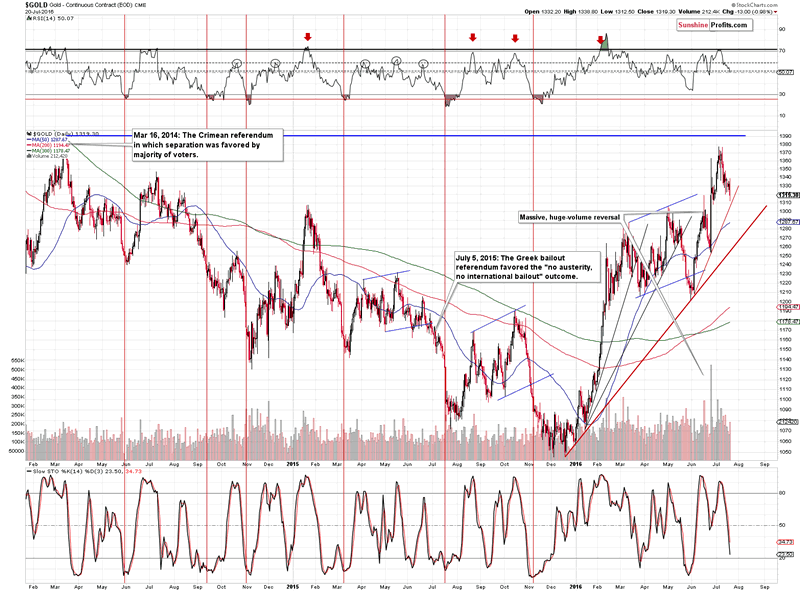
Gold declined on volume that was big on a relative basis (compared to the last few days) and it is clear that the breakout above the post-Brexit high is invalidated. The implications are bearish.
Why didn't gold decline more? Most likely due to the mentioned technical resistance in the USD Index and the rising support lines in gold itself. Still, given the breakout in the USD, it's likely that gold will follow and break down in analogy.
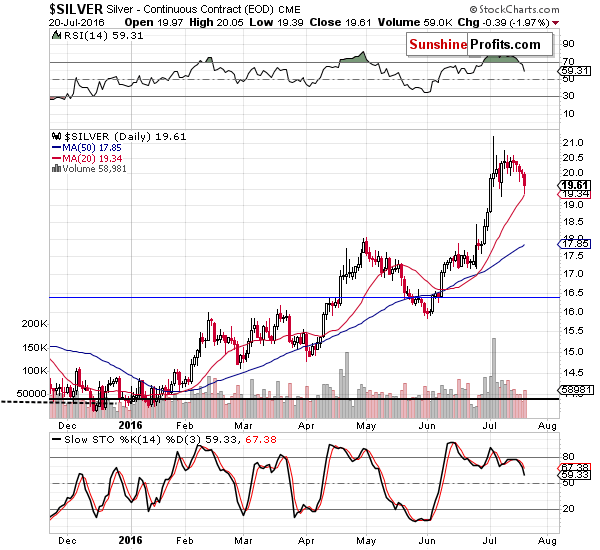
As far as silver is concerned, the white metal also moved lower on higher volume, but the more important volume reading was seen at the beginning of the month, when silver soared on an intra-day basis, only to slide later on. Then silver had an additional short-term run-up and it's now declining, moving to its 20-day moving average. The situation is very similar to what happened in late April and in the first half of May. Back then silver also had a huge-volume reversal, followed by a short-term run-up and subsequent decline. What can we infer from this similarity? That silver could spend a few days moving close to the 20-day moving average, just like it did in mid-May. The decline is likely to continue either after such a small consolidation or right away.
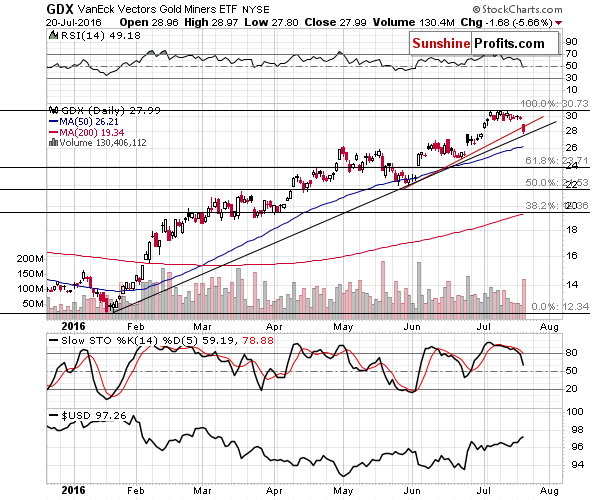
Similarly to what happened in the USD Index, the mining stocks broke below one support level, but hasn't broken below the lower one yet. However, the size of the volume was huge, which is an important bearish factor. What's also bearish is the fact that miners moved decisively below the most recent trading range - in the case of the previous huge-volume declines that we saw earlier this year miners remained within the trading range after the huge-volume slide (for instance in late March and in mid-May). Consequently, we can speak of a specific breakdown that has already happened.
Summing up, there are quite a few bearish signals for the precious metals market alone but there are very important ones just outside of the sector - the situation in the USD Index is likely to have significant impact on the prices of PMs and it's likely to be negative (and the likelihood of that happening increased based on this week's breakout). Once the short-term consolidation in the USD is over and the breakouts (above both the triangle and the 61.8% Fibonacci retracement) are confirmed, we are likely to see another sizable upswing in the latter, which is likely to correspond to a decline in gold, silver and mining stocks.
Finally, we would like to stress that the long-term outlook for the precious metals sector is positive due to the positive fundamental situation as far as the very long-term uptrend is concerned, but in the short- and medium-term the market can move lower despite a positive fundamental situation and what happened between 2011 and 2015 serves as a good example.
In order to stay updated on our latest thoughts on the precious metals market (including thoughts not available publicly), we invite you to sign up for our free gold mailing list. You'll also get free 7-day access to our premium Gold & Silver Trading Alerts. Sign up today.
Thank you.
Sincerely,
Przemyslaw Radomski, CFA
Founder, Editor-in-chief
Tools for Effective Gold & Silver Investments - SunshineProfits.com
Tools für Effektives Gold- und Silber-Investment - SunshineProfits.DE
* * * * *
About Sunshine Profits
Sunshine Profits enables anyone to forecast market changes with a level of accuracy that was once only available to closed-door institutions. It provides free trial access to its best investment tools (including lists of best gold stocks and best silver stocks), proprietary gold & silver indicators, buy & sell signals, weekly newsletter, and more. Seeing is believing.
Disclaimer
All essays, research and information found above represent analyses and opinions of Przemyslaw Radomski, CFA and Sunshine Profits' associates only. As such, it may prove wrong and be a subject to change without notice. Opinions and analyses were based on data available to authors of respective essays at the time of writing. Although the information provided above is based on careful research and sources that are believed to be accurate, Przemyslaw Radomski, CFA and his associates do not guarantee the accuracy or thoroughness of the data or information reported. The opinions published above are neither an offer nor a recommendation to purchase or sell any securities. Mr. Radomski is not a Registered Securities Advisor. By reading Przemyslaw Radomski's, CFA reports you fully agree that he will not be held responsible or liable for any decisions you make regarding any information provided in these reports. Investing, trading and speculation in any financial markets may involve high risk of loss. Przemyslaw Radomski, CFA, Sunshine Profits' employees and affiliates as well as members of their families may have a short or long position in any securities, including those mentioned in any of the reports or essays, and may make additional purchases and/or sales of those securities without notice.
Przemyslaw Radomski Archive |
© 2005-2022 http://www.MarketOracle.co.uk - The Market Oracle is a FREE Daily Financial Markets Analysis & Forecasting online publication.