


Gold Futures Point towards a Continuation of the Bullish Spell
Commodities / Gold and Silver 2016 Aug 02, 2016 - 02:27 PM GMTBy: Nicholas_Kitonyi

 The price of gold appears set to continue on a bullish run with gold futures pointing to a near-term target of about $1,400 while the long-term target could see the prices rise to new multi-year highs in the range of $1,500-$1,600 an ounce.
Last week, FOMC took the more reasonable option of failing to announce another US interest rate hike despite a strong nonfarm payrolls figure of 287,000 new jobs compared to just 11,000 in June. "Job gains were strong in June following weak growth in May," the FOMC said in its post-meeting statement, adding that "On balance, payrolls and other labor market indicators point to some increase in labor utilization in recent months."
The announcement resulted in mixed reactions from the equity markets with some Asian stocks rallying while others declined. On the other hand, US stocks declined momentarily before recovering the losses the following day while the price of gold continued to climb.
The yellow metal has enjoyed a bullish spell since the start of the year rising from as low as $1,040 an ounce to the current levels of about $1,365. Looking at the current gold price levels and the technical implications as illustrated in the chart below, the current rally could continue to the foreseeable future.
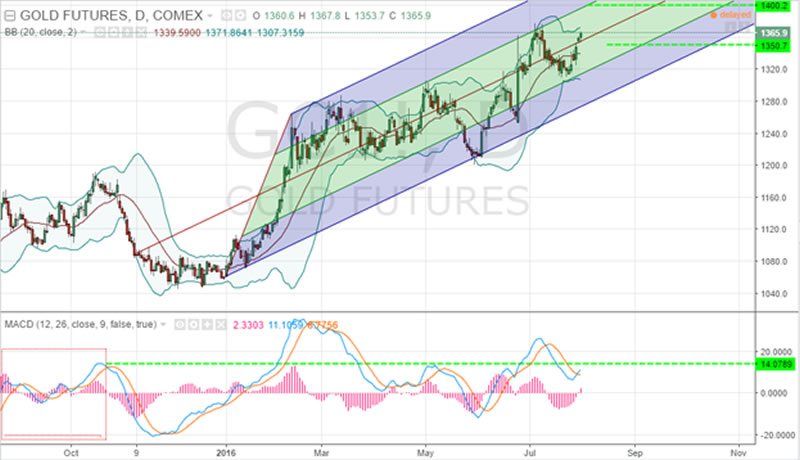
After a temporary pulldown in May that saw gold prices drop from $1,280s to close to $1,200, the yellow metal embarked on a rally that took it to the $1,370s level in early July. Since then, the price of gold has not fallen below the $1,300 mark and currently appears to be on course towards reaching the $1,400 mark for the first time since 2013.
In the Gold Futures daily chart above, the price of gold appears to be currently oscillating within the midsection of Andrew’s Pitchfork. It currently appears to have crossed over and above the median line, which suggests that the current rebound could continue until at least it breached the trending resistance at $1,400.
The momentum appears to be about to pick up after crossing up from a negative territory on the MACD histogram However, when you look at the weekly time frame chart below, the current upward movement appears to be lucking energy, and this brings about the question of how good the current momentum really is, on a larger time frame.
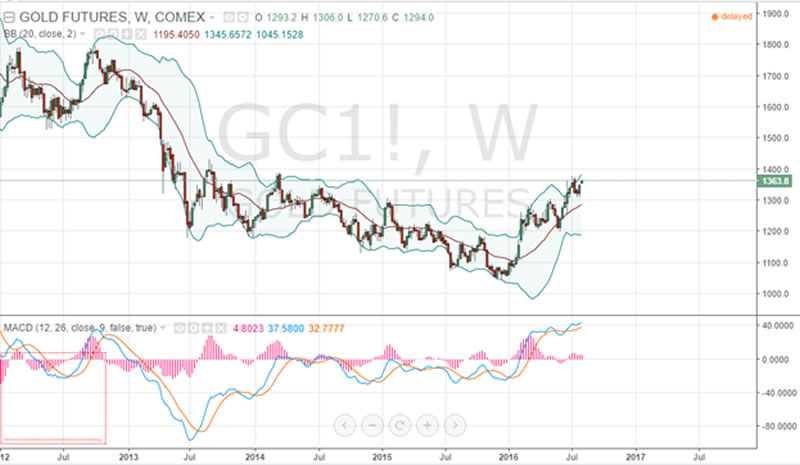
The MACD 12 and 26 lines also appear to at around the 40 points region, which suggests that the current upward run may be tiring thereby creating a potential reversal. In addition, the price of the yellow metal appears to be just about to breach the upper Bollinger band, which also points to a potential reversal, unless there is an impending breakout from the upward trending wedge.
Nonetheless, when you look at the monthly time frame chart below, there is more reason to be optimistic about the bullish trend in the price of gold. There is a strong momentum in the current rally as supported by the MACD histogram.
While the Bollinger bands appear to suggest that the rally could be coming to an end even on the monthly time frame chart, the two MACD moving average lines suggest that we could be about to witness a major crossover into the positive section after spending long spells in the negative territory.
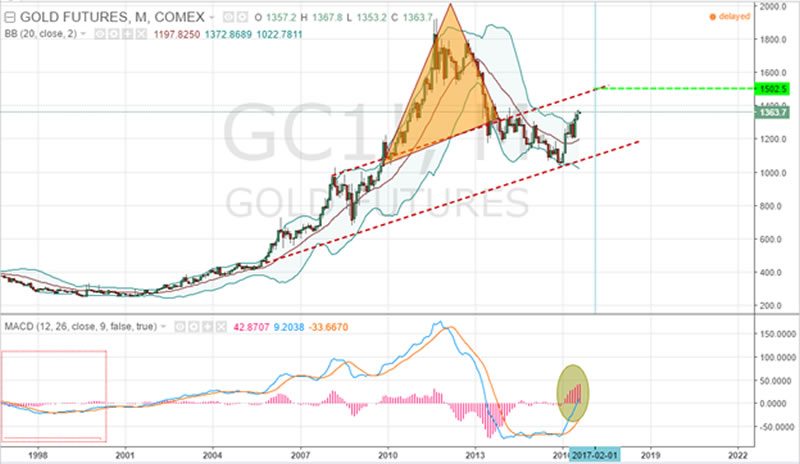
This suggests that gold price could be set on a rally for the long term. As indicated on the main chart, the price of the yellow metal could yet reach multi-year highs of up to $1,600, which were last witnessed during the abnormal price levels of 2011 to early 2013.
The price of gold experienced a market correction in 2013, and after enduring a tough campaign against the USD in 2014 and 2015, it now appears to have responded in kind after delivering what appears to be an unstoppable rally in the current calendar year.
The could be some obstacles ahead though, especially given the fact that the market still expects the US to increase interest rates at least one more time before the end of the year. There is speculation that this could come in September, but given the level of caution shown by the US Federal Reserve Committee, it is highly unlikely.
If anything, the more realistic time to tighten up the base interest rate could be in December this year, which would also match up well with last year’s increment. It makes sense if the Fed chooses to observe the situation for a year following the first rate hike since 2007.
In summary, the price of gold could continue in the current bullish spell as the Federal Reserve maintains caution over increasing interest rates further with the rate of inflation still low, and way off target.
By Nicholas Kitonyi
Copyright © 2016 Nicholas Kitonyi - All Rights Reserved Disclaimer: The above is a matter of opinion provided for general information purposes only and is not intended as investment advice. Information and analysis above are derived from sources and utilising methods believed to be reliable, but we cannot accept responsibility for any losses you may incur as a result of this analysis. Individuals should consult with their personal financial advisors.
© 2005-2022 http://www.MarketOracle.co.uk - The Market Oracle is a FREE Daily Financial Markets Analysis & Forecasting online publication.