Precious Metals Enduring Seasonal Weakness
Commodities / Gold & Silver Jul 25, 2008 - 01:11 PM GMTBy: Zeal_LLC
 For the most part, this summer has not been kind to precious-metals investors and speculators. While gold did rally rather sharply from mid-June to mid-July, up 12.6%, it could not challenge its $1005 March high. And soon after this retest failed it plunged $47, 4.8%, in just 2 trading days this week.
And silver hasn't fared much better. As usual it paralleled gold's mid-June to mid-July advance with its own rally, a healthy 16.3% surge. But this really wasn't all that much better than gold's own run, discouraging silver traders looking for outsized gains. And then this week silver mirrored gold's fast selloff with a steep 5.8% plunge of its own.
But the sickly PM stocks make gold and silver look like superstars by comparison. Despite incredibly high gold and silver levels historically, the flagship HUI PM-stock index just can't gain any traction. From mid-June to mid-July it rallied 18.2%, offering meager 1.4x leverage to gold. This is pathetic compared to bull precedent . Then this week the HUI plummeted 8.3% in 2 days in sympathy with gold's selloff.
Naturally this poor gold, silver, and PM-stock behavior is generating great concern among traders. Given the sorry state of the US dollar and all the financial-market turmoil, why isn't gold rocketing higher? Why is silver just grinding listlessly sideways way below its March highs? And why are these metals' elite miners trading at October 2007 levels today? Back then gold only averaged $756 and silver $13.70, far lower than today's prevailing prices.
What the heck is going on here? Are the precious-metals bulls in trouble? Not at all. Provocatively, the summers are virtually always slow for gold, silver, and the PM stocks. After studying these markets for many years, I've come to call this period the PM summer doldrums. Most of the time, even within the most powerful bull markets, the PMs spend the great majority of summer grinding sideways in consolidations.
Because of this phenomenon, back in late May we shifted our speculation focus to other areas for the summer months. On May 31st in our new June Zeal Intelligence newsletter I warned our subscribers about the coming PM summer doldrums. As this summer dawned I wrote, “The hard truth is that June and July are just not a great time to expect meaningful gold and silver rallies.”
“In light of this precedent, the most prudent course of action from a probability standpoint is to lower our PM expectations for summer 2008. If you add any PM-related positions, don't expect too much out of them until autumn. Don't get discouraged if your existing PM positions drift sideways to lower. When gold and silver grind listlessly, often the PM stocks will slowly drift lower as impatient traders sell.”
So if this lackluster summer action has surprised and discouraged you, it shouldn't have. Slow sideways-to-lower summer grinds are par for the course in PMs. This is one of the great benefits of being a student of the markets. By studying past behavior, one's expectations for future behavior can be tempered to align much more closely with probable outcomes. And if you're prepared, then you can't get discouraged.
In this essay I'll show you why I warned our subscribers about the PM summer doldrums in advance and shifted our short-term speculations to other arenas when summer dawned to avoid dealing with this grinding angst. Once you digest these charts, your own expectations for summer PM trading will probably be radically tempered as well.
In order to reveal the summer doldrums graphically, I designed some new charts for gold, silver, and the HUI. I started my analysis for each in 2000, the year in which the HUI bull was born (though gold's started in early 2001 and silver's in late 2001). I looked at each summer for all three in 2000 as well as every year since.
Realize that in the financial markets, summer runs from Memorial Day to Labor Day, June through August. This is when the kids are out of school and many traders are vacationing, leading to lower volumes across nearly all financial markets. In addition to these June-to-August market summers, I tacked on one month before and after for context. As you'll see, June, July, and August are indeed the classical PM summer doldrums traders need to be wary of.
In order to compare all these summers visually, I needed a common scale that transcended the whole price range of these entire PM bulls. So I individually anchored each summer at an index point of the close on the last trading day of May. I set this equal to 100. So if gold rallied 5% above its final close in May, it would hit an index level of 105. If it fell 5%, it would hit 95. This approach makes all summers perfectly comparable in percentage terms.
For 2000 to 2007, I rendered each summer's indexed results in yellow. While these lines look like a mess of spilled spaghetti on the charts, this is fine for this essay's purposes. We want to see the general summer trends across all years simultaneously as well as any outlying extremes. These 8 summers' yellow lines are then distilled down and averaged into a single red line. It really reveals the doldrums' prevailing trend.
On top of all this, I superimposed one final indexed line in blue. This is the summer-to-date performance in 2008. By comparing this line to the previous 8 summers' individual and collective performances, we can really see how summer 2008 is tracking relative to precedent. The PM summer doldrums are very real and quite demonstrable empirically, and all PM traders need to be aware of their implications.

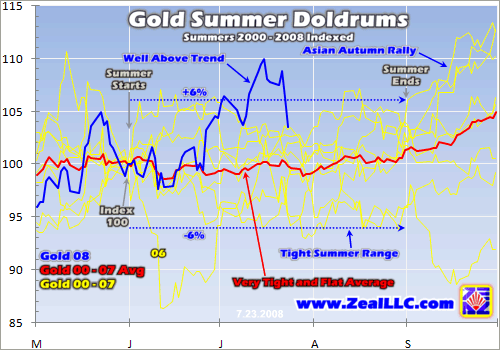
This chart is really amazing. Since April 2001, gold has been in its most powerful secular bull witnessed since the 1970s. Over this period of time, the Ancient Metal of Kings has nearly quadrupled, up 291.7%. Investors and speculators, including us and our subscribers, have made fortunes in precious metals since 2001. Yet as this chart shows, virtually none of these stupendous gains accrued in the summers!
Note that all the yellow lines, every summer between 2000 and 2007 indexed to 100 as of the last trading day of May, clustered in a tight trading range. Throughout this whole bull, gold's summers have been largely limited to plus or minus 6% swings from late May's levels! While there are a few temporary outlying areas, after all these years of bull precedent traders really shouldn't expect too much from gold in the summers. It usually just grinds sideways.
The red line averages the indexed gold summers between 2000 and 2007. Note that it is very tight, ranging from -2% to +1%. In addition, it is pretty much dead flat, hugging the 100 level closely in June, July, and August. This average is gold's expected bull-market path during the summer doldrums. Thus you can see why I warned our subscribers in late May not to expect much from gold this summer.
Interestingly, gold's recent sharp rally from mid-June to mid-July 2008, rendered in blue, actually ran well above trend. This was much higher than I expected. Nevertheless, we were gaming gold's summer trading range in Zeal Speculator . I recommended GLD calls in mid-June (low in the range) that we ended up selling in mid-July (high in the range) at an 87% realized gain. So even as gold drifts sideways, traders can buy low and sell high within its summer range.
With gold running so far above trend this year, it shouldn't be surprising that it has corrected sharply this week to get back into trend. The PM summer doldrums are a tough master that is seldom cheated for long. Gold will likely continue lower into this range in late July and early August. Provocatively, to hit the -6% lower part of its typical range this summer, gold would need to go as low as $835! Although I really doubt this will happen this summer, if it does it is not abnormal at all relative to this bull's precedent.
These doldrums may seem bleak, but the purpose of summer consolidations is to build a high base for gold's powerful autumn rallies. In September you can see these rallies launching in this chart, and they are very apparent in full gold seasonal charts as well. Strategically, the summer doldrums lay ever-higher foundations for the autumn gold buying spree emerging after Asian harvest and running into the Indian wedding season. So in a broader context, the PM summer doldrums are nothing to fret about.
As the king of precious metals, gold's behavior colors all PM sentiment. Silver and PM-stock investors and speculators always look to gold for trading cues. If gold isn't thriving, neither will silver or PM stocks. And since silver and the PM stocks are essentially speculative proxies on gold itself, it is not surprising that both silver and the HUI tend to mirror gold's listless summer grind.
Silver in particular virtually always follows gold. Stretching back to at least the 1970s, you just can't find a meaningful silver upleg that wasn't spawned by a parallel gold upleg. Countless gold and silver charts reveal this indisputable market history with crystal clarity. Thus it is not surprising that as gold drifts in the summers, silver generally follows it. Without gold's lead, silver speculators rarely get excited about buying.

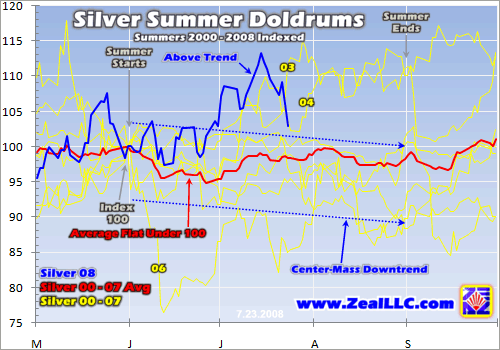
As silver is far more volatile than gold, its summer-doldrums trend is not quite as clean-cut. Nevertheless, the center-mass trend based on silver's indexed summers between 2000 and 2007 is definitely down. 5 of these 8 summers spent almost all of their time in the downtrend rendered above. And none of the 3 outliers could spend more than 2 months at a time outside of this prevailing downtrend.
While gold's red summer average line meandered around 100, silver's actually grinds under it. The red line above runs between 95 and 100 indexed. This means, on average, silver is usually grinding slightly lower rather than just flat during the summers. And this is logical. If gold is flat, it isn't generating any PM excitement. And without gold's lead, silver sellers can overwhelm buyers causing its price to drift lower.
Interestingly July 2008 was also silver's best summer performance yet, carrying it above trend. Since it blasted so far out of its typical range, once again this week's sharp correction shouldn't be too surprising. Probabilities are high that silver will need to head back down into its typical summer trend before this summer draws to a close. If it merely grinds sideways this summer as usual, silver has plenty of short-term downside left.
Although gold only had one outlying summer, the sharp June 2006 downside which happened during a major correction following a euphoric upleg climax, silver had three. It shared gold's June 2006 correction of course, but also saw upside outlying years in 2003 and 2004. Both started in July at very low absolute prices. In early July 2003 and 2004 silver was running $4.55 and $5.90 respectively. Like any long-beaten-down asset, silver was more likely to surge suddenly early in its bull since it was so oversold.
Interestingly 2008 is the first upside-outlying summer we've seen since 2004. I know this silver surge was driven by gold's own surge, which I suspect was sparked by the sharp financials-led selloff in the general stock markets and concurrent US dollar selling. But the key point is once gold retreated, silver did too. So if gold continues grinding lower into its typical summer trading range, the odds are high that silver will dutifully follow like usual.
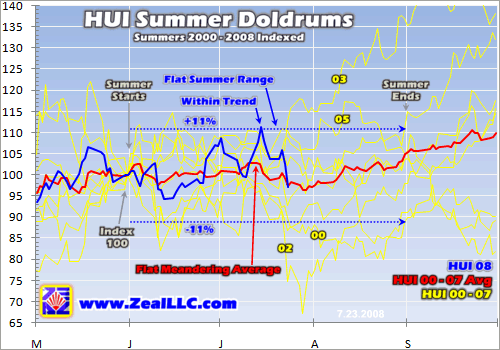
While gold and silver have both been above trend this summer, the HUI has not. PM-stock traders are very discouraged, partly because so many had such high expectations going into this summer. Most have probably never heard of the PM summer doldrums so this sideways action is likely crushing their will to keep playing the game. Yet as this chart shows, the HUI's lackluster behavior this year is quite typical of the summer doldrums.

The HUI's summer-doldrums pattern is more variable than gold's or silver's. In June and most of July, for every summer since 2000 the HUI has traded in a flat summer range between -11% to +11% of its final close in May. Translated into today's HUI levels, in 2008 this range runs from 375 to 468. And interestingly this summer the HUI has traded between 397 and 469 on a closing basis, which is right in line with precedent.
But then in late July and August, probabilities shift significantly. During half the summers from 2000 to 2007, the HUI continued grinding sideways in its summer-doldrums range. But during the other half, the HUI has blown out of this range to the upside and the downside in equal measure. 2003 and 2005 saw upside breakouts in late July and August, while 2000 and 2002 saw downside breakouts. Other than 2003 though, a young major upleg, all these breakouts soon retreated back near or within the -11% to +11% summer range.
On an average basis, the HUI tends to run flat in the summer too. Its red line generally meanders within a few percent of flat in both directions from the final HUI close in May. It also tends to get a bit weaker in late July and a bit stronger through August. This implies that our current HUI selloff may run for another week or two before we start recovering a bit. Most of the yellow lines slide lower in late July, a period of sharp seasonal weakness .
So as these charts reveal, the PM summer doldrums are a very real phenomenon. And this is even during the exceedingly powerful secular bulls in gold, silver, and the HUI that have unfolded since 2000. This analysis certainly does not suggest that the PMs can't rally in the summer, just that probabilities are stacked against any significant rally. Traders would do well to remember this heading into future summers.
If your expectations are properly set heading into summer, then you won't suffer any psychological damage from the typical lackluster grind. Prudent PM investors and speculators write off most of the summer, accepting the near inevitability of the drift. Then in late August they start buying aggressively in anticipation of the usual autumn gold rally driven by Asian buying. Most of these PM bulls' gains have accrued between September and February , the highest-probability-for-success time to be long.
As a student of the markets, I've been aware of this PM-summer-doldrums tendency for some time. I love studying the markets not simply because they are fascinating, but because this research helps me understand when probabilities are most in my favor to open or close real-world trades. While deep market research takes countless hours and isn't for everyone, you can easily share in the fruits of our labors at Zeal.
We publish acclaimed monthly and weekly newsletters that integrate all of our ongoing research into uncovering real-world trading opportunities for our subscribers. For a relatively trivial subscription fee, you can put many years of trading experience and endless hours of market research on your side. Subscribe today as we start heading into August and preparing to deploy new PM positions soon ahead of the usual major autumn rallies in gold, silver, and the PM stocks.
The bottom line is the precious-metals realm virtually never does well during the summer months, even within the strongest of secular bulls. For a variety of global supply-and-demand reasons, gold tends to drift sideways in June, July, and August. Since gold's behavior heavily colors sentiment for everything PM-related, silver and the PM stocks parallel the yellow metal in lackluster summer consolidations.
But if you expect these PM summer doldrums, and trade accordingly, you can be really well-positioned for the big autumn rallies spawned by a surge in gold buying out of Asia . Managing one's PM summer expectations down to low levels is crucial for PM traders' psychological well-being during these slow months. Thankfully this slowest time of the year seasonally is followed by the best seasonal time.
By Adam Hamilton, CPA
So how can you profit from this information? We publish an acclaimed monthly newsletter, Zeal Intelligence , that details exactly what we are doing in terms of actual stock and options trading based on all the lessons we have learned in our market research. Please consider joining us each month for tactical trading details and more in our premium Zeal Intelligence service at … www.zealllc.com/subscribe.htm
Questions for Adam? I would be more than happy to address them through my private consulting business. Please visit www.zealllc.com/adam.htm for more information.
Thoughts, comments, or flames? Fire away at zelotes@zealllc.com . Due to my staggering and perpetually increasing e-mail load, I regret that I am not able to respond to comments personally. I will read all messages though and really appreciate your feedback!
Copyright 2000 - 2008 Zeal Research ( www.ZealLLC.com )
Zeal_LLC Archive |
© 2005-2022 http://www.MarketOracle.co.uk - The Market Oracle is a FREE Daily Financial Markets Analysis & Forecasting online publication.


