


When Does a Forecast Become a Trade?
InvestorEducation / Learn to Trade Aug 17, 2016 - 01:51 AM GMTBy: EWI

 Learn why it's important to wait for confirming price action before pulling the trigger
Jeffrey Kennedy, the editor of our popular Trader's Classroom educational service, weighs in on how you know when it's time to enter a trade.
[Editor's Note: A text version of the video is below.]
Alexandra Lienhard: When does analysis become actionable? That's a question many ask themselves when analyzing and trading financial markets. To answer that question, I've got Jeffrey Kennedy joining me today. Jeff is the editor of Elliott Wave International's popular Trader's Classroom educational service.
Jeff, you recent published a Trader's Classroom lesson discussing the importance of waiting for confirming price action before entering a trade. Something you often tell your subscribers is that once you finish your analysis, you need to take off your analyst hat and put on your trader hat. But for many, perhaps easier said than done! So Jeff, how do you know when analysis becomes actionable?
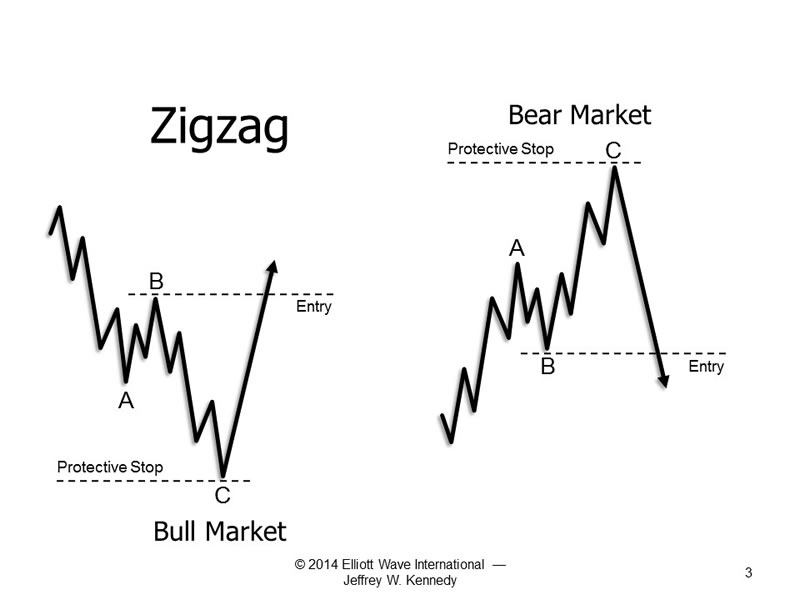
Jeffrey Kennedy: Well, simply put, when you have enough evidence. For example, if you're counting a move to the downside as a counter-trend price move, say specifically a zigzag, it's going to be a 5-3-5 pattern typically contained within parallel lines. That's your foundation, that's your core. What you need to do next is simply wait. Wait for confirming price action because if your analysis is indeed correct, prices indeed will respond exactly the way you foretasted them to. So what sometimes I do is I'll actually wait for example a bullish engulfing pattern on the heels of an A-B-C decline to really provide additional evidence of the original forecast and then that's when I begin to take action. Simply put, again it goes all the way back to evidence, price evidence.
Alexandra: And the example you just spoke of actually reminds me of a section in your book, The Visual Guide to Elliott Wave Trading. You have a portion where you go through the 5 core Elliott wave patterns and offer guidelines for entering a trade upon the completion of each pattern. Can you take me through a conservative guideline on how to enter a trade upon completion of one or two of the core patterns?
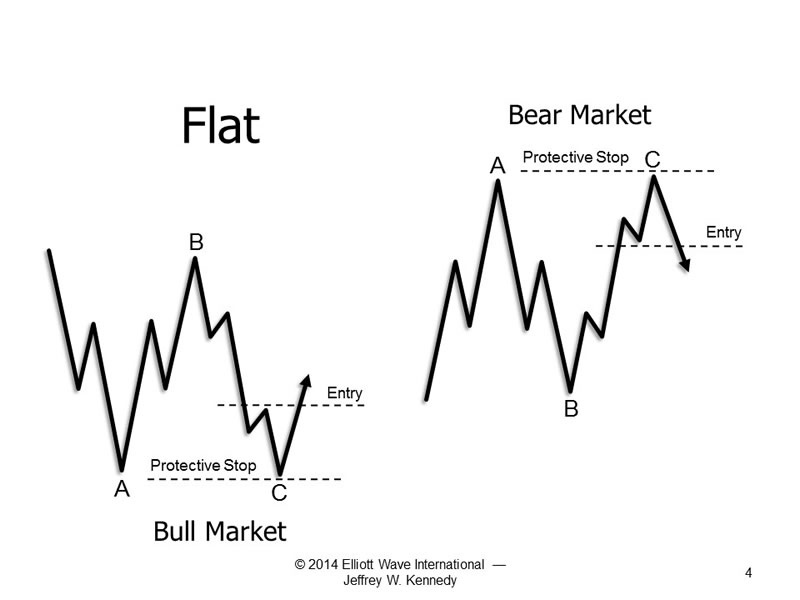
Jeffrey: Well, there are 5 core Elliott wave patterns: the impulse wave, the ending diagonal, the zigzag, the flat and the triangle. In The Visual Guide to Elliott Wave Trading book I outline specific guidelines on how to enter a trade following each pattern. Just for an example, on the heels of a zigzag, a 5-3-5 pattern, A-B-C, I typically like wait for prices to exceed wave B extreme before actively looking for say a buyside trade setup. If we were working for example a flat pattern, then typically my confirmation point is that I want to see prices exceed the extreme of wave 4 of C before aggressively looking to take action.
Alexandra: And those are examples of how to enter a trade following the completion of two of the core patterns, but you go through many more in your book, The Visual Guide to Elliott Wave Trading, which as a side note, is a great read for any analyst or trader who are interested in learning how to spot high-confidence trade setups for themselves. Jeff, as always, it's been great to chat with you. Thanks for talking with me today.
Jeffrey: My pleasure Alex, any time.
Alexandra: If you analyze and trade financial markets and haven't read The Visual Guide to Elliott Wave Trading -- you should. Using more than 200 charts and 20 market examples, Jeffrey Kennedy and his co-author Wayne Gorman teach you how to identify high-opportunities trade setups in your own charts. Best of all, you get this book free when you subscribe to Jeff's Trader's Classroom educational service.
|
Learn "The 4 Best Elliott Waves to Trade -- and How to Trade Them" -- FREE. Join Trader's Classroom editor Jeffrey Kennedy August 17 - 23 for free daily video lessons that will teach you to find -- and act on -- trade setups in your own charts. Learn which waves offer the best trade setups, how to set price target with Fibonacci and more. |

This article was syndicated by Elliott Wave International and was originally published under the headline When Does a Forecast Become a Trade?. EWI is the world's largest market forecasting firm. Its staff of full-time analysts led by Chartered Market Technician Robert Prechter provides 24-hour-a-day market analysis to institutional and private investors around the world.
About the Publisher, Elliott Wave International
Founded in 1979 by Robert R. Prechter Jr., Elliott Wave International (EWI) is the world's largest market forecasting firm. Its staff of full-time analysts provides 24-hour-a-day market analysis to institutional and private investors around the world.
© 2005-2022 http://www.MarketOracle.co.uk - The Market Oracle is a FREE Daily Financial Markets Analysis & Forecasting online publication.