


Precious Metals Markets : Zoom Out
Commodities / Gold and Silver 2016 Aug 21, 2016 - 05:29 PM GMT

 When looking at the short term minute charts things look very volatile in the precious metals complex but the further you look back in time the less volatile the price action becomes. If one is a day trader then the minute charts are the ones to focus in on but if you’re an intermediate term trader perspective is everything.
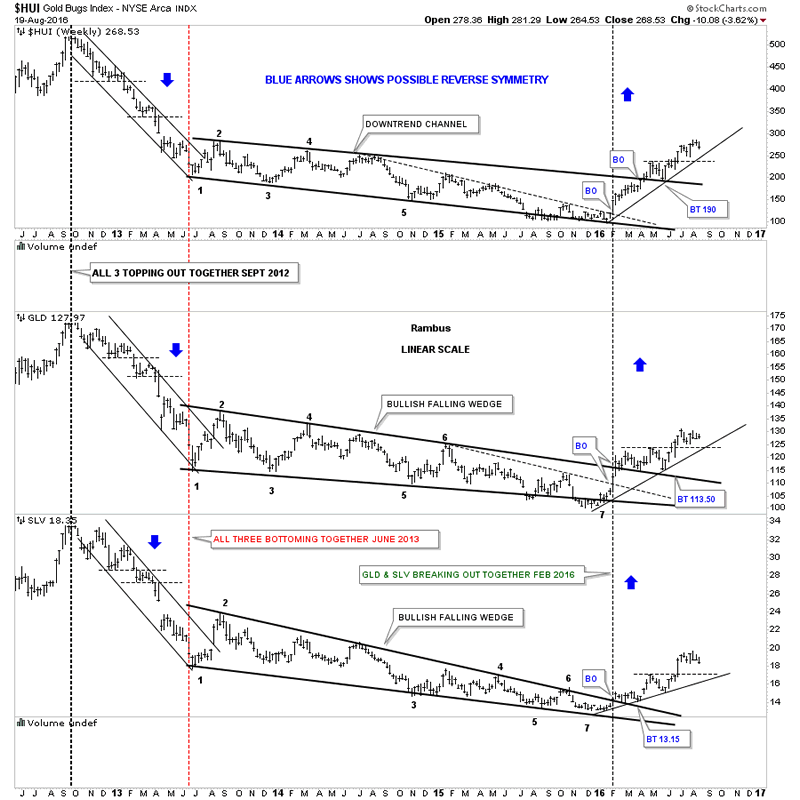
Looking at the five year weekly combo chart below the precious metals complex has been building out a beautiful uptrend since the January 2016 low. There is nothing on any of these three charts that suggests a top is in place and it’s time to sell. The thin black dashed horizontal lines taken from the previous highs is our first line in the sand for support. Note the left side of the chart and how the thin black dashed horizontal lines held resistance when they were broken to the downside which is bear market action. What we have since January is bull market price action.
If one had tried to buy any of these three sectors during the impulse move down out of the 2012 top to the June 2013 low for a counter trend rally, they would have been crushed like a bug against the windshield of a car. Even if I gave you the exact low could you have reversed back to the short side in time to protect any of the small profits you may have made? Looking at the price action since the January 2016 low, how many traders do you think have won big shorting this new bull market?
The golden rule is, don’t buy a bear market and don’t short a bull market. There are always exceptions to the rule but for the little guy, that doesn’t understand how the markets work, it’s like taking candy from a baby , for those that truly understand how the most difficult game on the planet works.
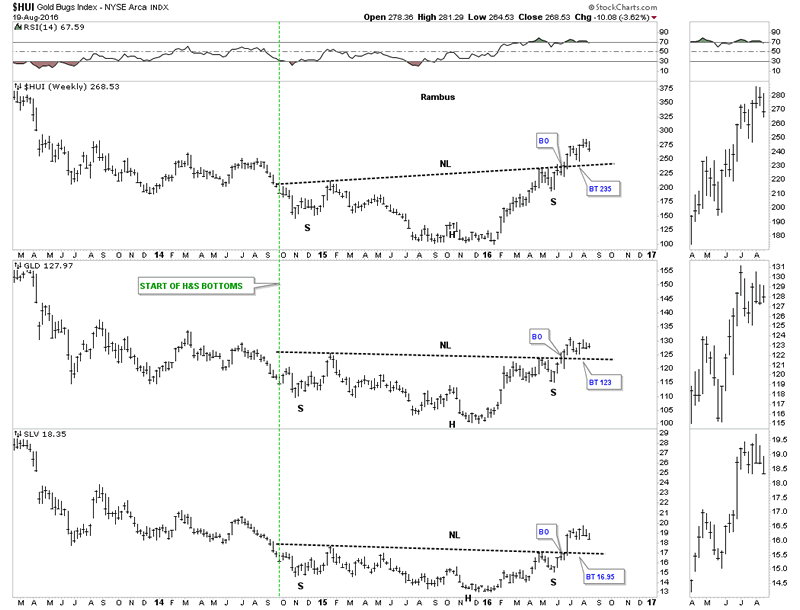
Below is the inverse H&S combo chart for the HUI, GLD and SLV. Think of the necklines as your line in the sand, above is bullish and below is bearish. Until they’re breached to the downside I have to remain a bull and everything else is noise. It doesn’t have to be complicated. Have a great weekend and all the best…Rambus
All the best
Gary (for Rambus Chartology)
FREE TRIAL - http://rambus1.com/?page_id=10
© 2016 Copyright Rambus- All Rights Reserved
Disclaimer: The above is a matter of opinion provided for general information purposes only and is not intended as investment advice. Information and analysis above are derived from sources and utilising methods believed to be reliable, but we cannot accept responsibility for any losses you may incur as a result of this analysis. Individuals should consult with their personal financial advisors.
© 2005-2022 http://www.MarketOracle.co.uk - The Market Oracle is a FREE Daily Financial Markets Analysis & Forecasting online publication.