Gold Bullion Stabalises Whilst Gold Stocks Heading into Bear Market Territory
Commodities / Gold & Silver Jul 26, 2008 - 02:00 PM GMTBy: Merv_Burak
 Two bad days but the week ended with a little bit of stability. I don't think it will last. However, which direction next is the question.
GOLD : LONG TERM
The long term takes time to change direction, when it decides to change. Despite several weeks of not so good gold trading activity and some time spent below its long term moving average line, gold has not yet reversed its long term bullish rating. While gold was below its moving average line the line slope remained positive. And through it all the long term momentum indicator remained positive, although at times below its trigger line.
As of the Friday close gold remains above its long term positive sloping moving average line but once more very near moving below the line. The long term momentum indicator (looking at the daily version) is basically in a lateral trend slightly above its neutral line. It has been moving above and below its trigger line for a few months undecided as to which way the wind will finally blow. More encouraging is the long term chart of the volume indicator. Although I do not place any great confidence in the volume indicator for long term trends (it is too often a lagging indicator at market tops), especially after any major advance has already taken place, it may still be comforting that the majority of volume is still to the up side. Putting it all together, the long term rating remains BULLISH .
INTERMEDIATE TERM

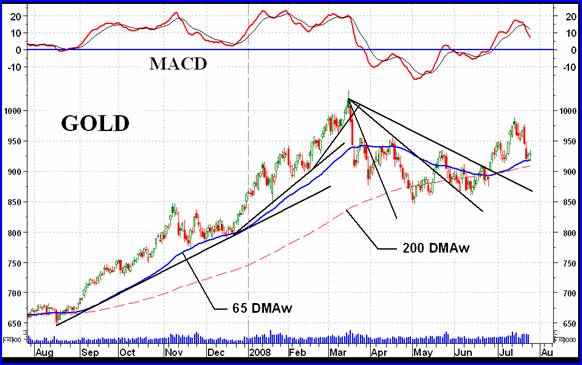
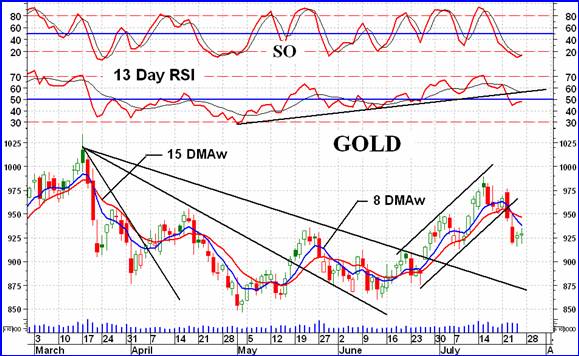
If you read these commentaries long enough you will guess that I like to draw the FAN trend lines. That is because many years ago I had developed my own version of the FAN Principle and found it to be very beneficial. Here we see two versions of the FAN trend lines, one a bearish accelerating FAN with a “blow-off” stage and the other a bullish decelerating FAN. As mentioned, they are very beneficial in determining a change of trend but they do not always work perfectly so one must still look at the other indicators and charts for confirmation.
Despite a couple of mean days this past week the bullish intermediate term situation remains unchanged. Gold remains above its intermediate term positive sloping moving average line although only slightly above. Although the momentum indicator has moved below its now downward sloping trigger line it remains in its positive zone. This is reflected in the MACD shown today as well as my normal momentum indicator (the 50 day RSI). The volume indicator had been acting quite positively over the past several weeks although it is in a slight reaction mode these past few days. It has hit new all time highs a couple of weeks ago, something the price of gold has not done yet. BUT, as mentioned earlier, the volume indicator has a nasty habit of being a lagging indicator at market tops so one cannot totally rely on it after a significant market bullish move. Hope but not certainty. For now the intermediate term rating remains BULLISH .
SHORT TERM

Technicians love to draw lines, be they trend lines, FAN lines, channel lines, support and resistance lines or what have you. A well defined line very often warns you that whatever was going on before, a crossing of the line has changed that movement. A short term up trend may have changed into a short term down trend. Likewise for intermediate and long term trend crossings. Lousy drawn lines can cost you capital but a well drawn line could help save you a lot of misery. For the non-believers in technical analysis out there (and trend lines are a technical tool), great, keep it up. Technicians need someone to sell to at the top and someone to buy from at the bottom (or very near those locations). Yes, we also make mistakes but the charts very quickly warn us of the mistake and get us out with minor losses, or minor loss of gains. (an interesting question “when does a fundamental analyst warn you that a mistake was made, or does he?”)
Tuesday we had our down side break with everything, including the moving averages, going negative. By the week-end stability may have entered the market but I would not expect it to last. The plunge halted at the support from the previous early July low and the intermediate term moving average line. The action of the past couple of days has been more of a halt to the down move rather than a reversal of the down trend. That may come with another day or two of upside action. The aggressive Stochastic Oscillator had moved into its oversold zone and below its trigger line but on Friday it moved back above the trigger, although still in the oversold zone. The trigger is sill in a negative slope so maybe it would be a little premature to say that the immediate term trend has shifted to the up side but it's very close. The short term still has to be rated as BEARISH and it would need another couple of days to change that rating.
SILVER
There are some differences between the action in silver and that in gold, however, at this point they are not serious differences. As an example, the down move in gold halted at the previous early July low while silver has moved below its likewise low. The intermediate term momentum indicator for silver has just inched very slightly below its neutral line while gold momentum is still slightly above its neutral level. Silver has also moved below its neutral intermediate term moving average line. Because of the minor differences between the two one can say that silver is acting somewhat weaker than gold, at least at this time. Otherwise, the two are basically acting together.
MERV'S PRECIOUS METALS INDICES
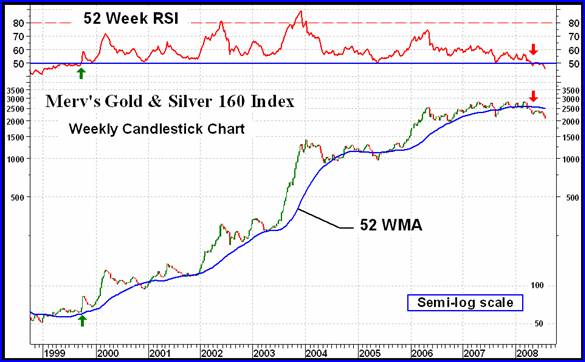
It's been some time that I've had a chance to comment on what the universe of gold stocks have been up to. You might ask why that is important. Well, too often the stocks have played the roll of a leading indicator as to where gold itself will be heading. And that leading indication is not a pretty picture. The chart is that of my universe of 160 precious metal stocks. In this universe are the top 100 stocks traded on the North American market, by market value. The remainder is an assortment of speculative and gambling variety of stocks. My chart of the top 100 stocks traded on the North American market (the 160 minus the speculative and gambling stocks) has a very similar trend.
Here, I view a very long term chart of the 160 Index using a one year (52 week) simple moving average and a one year (52 week) RSI for momentum. The first thing one notices is that the universe started its bull move two years BEFORE gold really took off (the 160 above its positive sloping moving average line AND momentum above its neutral line). By time gold had a similar break-out as did the 160, the 160 was already ahead by over 100%. Not as easily noticeable since I have not shown the gold chart, the final peak in the momentum of the move in the 160 occurred 2 years before the final peak in momentum was reached in the gold movement.

Although the 160 Index continued to move higher after its late 2003 peak (the location of the momentum highest peak), momentum from there on just got progressively weaker. Finally, in late April we had both the momentum dropping into its negative zone AND the Index moving below its negative sloping moving average line putting the 160 Index into a long term BEAR market situation.
Gold, on the other hand, is still some distance from a similar break-down. Could it be a 2 year lag? I don't know but the prognosis is that one should be very cautious about any gold bullion investments.
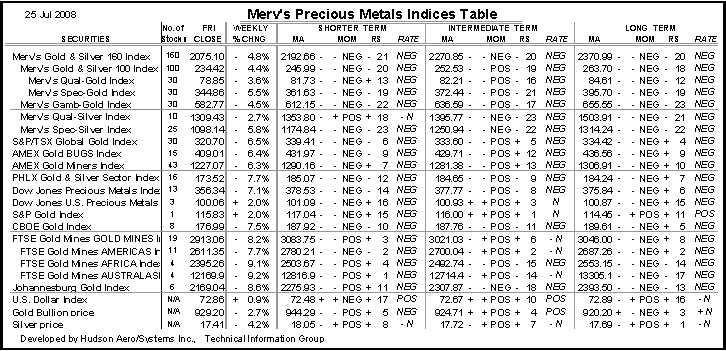
As for precious metal stocks in general, well the % of stocks in bullish trends versus the % in bearish trends tells the story. The % bullish ratings are in the 12 to 16% range for all time periods while the % bearish ratings are in the 71 to 79% range. Although the % of stocks in bearish trends is overwhelming that % could still go much higher. It is a very, very risky game at this point to be on the buy side for precious metal stocks.
STOCKS VERSUS GOLD BULLION
At this point in time we still have gold bullion in a bullish phase while stocks are in a bearish phase. This cannot last forever but as the past has shown, gold could go on in the bullish phase for two years before reversing. On the other hand it could be that stocks just might reverse and go into a new bull market. I would not count of that happening in advance of the happening. Wait for the charts and indicators to signal that a change has occurred before jumping back into the precious metals stocks. The Merv's Precious Metals Indices Table (usually at the end of these commentaries) is a good place to check for this happening.
Surfing the internet I see a great many commentaries that gold is set to go through the roof. That may happen and if it does we will follow it. Gold stocks may still under perform in such a case so caution is the operative word.
Merv's Precious Metals Indices Table

That's it for another week.
By Merv Burak, CMT
Hudson Aero/Systems Inc.
Technical Information Group
for Merv's Precious Metals Central
For DAILY Uranium stock commentary and WEEKLY Uranium market update check out my new Technically Uranium with Merv blog at http://techuranium.blogspot.com .
During the day Merv practices his engineering profession as a Consulting Aerospace Engineer. Once the sun goes down and night descends upon the earth Merv dons his other hat as a Chartered Market Technician ( CMT ) and tries to decipher what's going on in the securities markets. As an underground surveyor in the gold mines of Canada 's Northwest Territories in his youth, Merv has a soft spot for the gold industry and has developed several Gold Indices reflecting different aspects of the industry. As a basically lazy individual Merv's driving focus is to KEEP IT SIMPLE .
To find out more about Merv's various Gold Indices and component stocks, please visit http://preciousmetalscentral.com . There you will find samples of the Indices and their component stocks plus other publications of interest to gold investors.
Before you invest, Always check your market timing with a Qualified Professional Market Technician
Merv Burak Archive |
© 2005-2022 http://www.MarketOracle.co.uk - The Market Oracle is a FREE Daily Financial Markets Analysis & Forecasting online publication.


