


Stocks Bear Market Fed by Falling Earnings Expectations
Stock-Markets / Corporate Earnings Jul 26, 2008 - 04:04 PM GMTBy: John_Mauldin

 Earnings and Mr. Bear
 - Earnings Before Bad Stuff
- How Ugly Can it Get?
- A Lean Mean Reversion Machine
- Some Thoughts on Energy
"The stock market is a voting machine in the short run and a weighing machine in the long run." - Benjamin Graham
The voting part of the equation is tempered by fear and greed. It is largely emotional, although investors like to think of themselves as rational players. That emotion is driven by views of the future. If you can be confident of large and growing returns, you are less likely to be swayed by the erratic movements of a stock. But as confidence wanes? Well, that is the stuff that bear markets are made of.
Because at the end of the day, what the market weighs is earnings and the ability of a company to reliably produce them. This week we look at what earnings are likely to be over the next year and see if we can discern what that suggests for the markets. We also take a look at the energy markets, the possibility of a further drop in the price of oil, and muse on what a sane energy policy for the world would look like. There is a lot to cover, but it should make for an interesting letter.
But first, a quick announcement. I have recently agreed to do a regular interview each issue with the editors of EQUITIES Magazine, which will be in the magazine and on their web site. They are also going to feature me on their web-site home page with my latest writings, under the title "Guru Blog." I am excited to be associated with a magazine that has been around for 57 years.
In return, they have agreed to give any reader of mine a free subscription to EQUITIES Magazine. You can go to http://www.equitiesmagazine. com/mwi and simply register and get the magazine sent to your home. There is also a link to an interview I did in April with them. They have a lot of content and free resources like real-time stock quotes and portfolio managers. Check it out!
Earnings and Mr. Bear
A theme in this letter for many years has been that over time markets of all descriptions revert to the mean. The classic definition of mean reversion is "the behavior of a variable in which the values for that variable move towards the long-run average value for that variable." Prices, indexes, and all types of economic variables tend to fluctuate around their long-term averages.
Profits as a percentage of nominal GDP is one of the more significant mean reversion examples. Last year we saw pre-tax profits as a percentage of nominal GDP climb to a 55-year high of 14%, which is really rather astounding. Why? Because over time, profits track nominal GDP. In the post-World War II era, nominal GDP growth has averaged 7.1%, while profit growth has averaged 7.4%. Profits over the long term as a percentage of GDP have not changed significantly for generations. Or put another way, profit growth has matched GDP growth. We will examine later what might happen if profits reverted to their long-term average (think ugly).
Now, in the short term, the difference between corporate profits and nominal GDP can vary wildly. But in the fullness of time, economic pressures will work to bring corporate profits back to the mean. This can come in the form of higher or lower wages, changes in productivity, higher or lower taxes, recessions, or growth booms. All of these and more affect corporate profits.
Let me give you one more way to look at it. If the economy is growing at 7% (nominal), then corporate profits cannot continue to grow for more than a few years at 15%. If that growth trend continued, then at some point in the future the entire GDP would consist of corporate profits, as each year the percentage of corporate profits in the GDP would increase. Since trees cannot grow to the sky, nor can corporate profits become larger than the economy, and so logic dictates that there will be an adjustment in the future. And we are beginning to see that logic play out. Let's look at a few numbers.
Trailing as-reported 12-month corporate profits on the S&P 500 peaked in the second quarter of 2007 at $84.95. In March of 2007, S&P forecast 2008 earnings would be $92. Then the economy began to run into trouble and S&P began to drop their 2008 forecasts, as the table below shows. (By the way, this is not to pick on S&P. Nearly every major forecast had similarly optimistic views.)

What actually happened? 2007 earnings actually came in at $66.18, following a lot of ugly write-offs in the last quarter. The estimate for 2008 is $72.01, as you can see above. Interestingly, they project lower earnings for 2009, down to $67.66. At today's closing price of 1257, that projects to a lofty price to earnings (P/E) ratio of 18.55, well above long-term averages and well above trend for periods of poor or no growth. For the record, there is no record in history of a bull market starting at a P/E of 18.
Earnings Before Bad Stuff
One other interesting statistic that caught my eye: Reported earnings are what you pay taxes on. They are what you really made. S&P also estimates operating earnings, or as I characterize them, Earnings Before Bad Stuff, or Earnings Before BS. There has been a lot of Bad Stuff of late. Operating earnings for 2007 were almost 25% higher than reported (real) earnings, and about 15% (so far) for 2008.
But the analysts at S&P must expect a lot of Bad Stuff in 2009, because they project a difference of almost 45% in 2009. Remember that they project real earnings to be $67.66 in 2009? Well, they project operating earnings to be a whopping $108.60. That will be a growth in earnings of almost 25% in 2009.
Before we get into whether such earnings growth is likely, think about an environment where company after company keeps reporting large write-downs every quarter. Of course, they will tell you it is just this once, so don't sell us - now is a buying opportunity. Long-time readers know that I have written on several occasions about how continuing earnings disappointments are what create a bear market. Typically it takes at least three to really get the attention of analysts and investors, who begin to lower their projections for both profits and price targets.
How Ugly Can it Get?
David Rosenberg, the North American Economist at Merrill Lynch, is one of my favorite analysts. He is a mainstream economist who is most definitely not a cheerleader. He can be quite bullish as times, and when he thinks the times call for it, he can be rather bearish. As we will see below, he is quite bearish of late. I am going to quote from his opening remarks in a commentary dated July 25, where he is changing his forecast. Remove sharp objects from your nearby vicinity.
"Forecast addendum: Adjusting to the new reality
"Just like consumers, who are insulating their windows and making fewer trips to the malls, we are adjusting our economic forecast to the new high-oil price reality not to mention the latest round of trauma in the mortgage markets. Though fiscal stimulus [rebate checks] will provide a lingering boost to 3Q we expect GDP to plummet 2.5% in 4Q and see a similar decline in 1Q. In all, we have shaved our 2009 GDP forecast to -0.5%, a full percentage point lower that where it was previously, while 2008 is broadly unchanged at 1.5%.
" Less consumer, more unemployment, profit squeeze ahead
"The scenario we ran last May, when we shocked the model with higher oil prices, now appears to be playing out as predicted. With rebate check delivery winding down, there is now little shielding the consumer from the full force of $4+ gasoline, deflating real estate and equity markets and rising unemployment. The new reality means a deeper downturn for consumers, higher headline inflation, more belt-tightening from businesses and a mammoth profit squeeze. It also keeps the odds squarely in favor of more rate cuts from the Fed, in our view.
" Back to the 1970s
"Once the last of the rebate money is spent, in either July or August, consumer spending is expected to roll over, and hard. The oil shock we're experiencing is on par with the spike in the mid-1970s and consumer spending will see a similar downturn, in our view. The unemployment rate will probably crest at about 7.0% in mid-2009, a half percentage point higher than our previous outlook. We're expecting a 3.0% decline in PCE in 4Q 2008 and 1Q 2009 does not promise to be much better. We look for savings to rise, as consumers adjust to the tighter credit environment by building their savings rate up to 2-3/4% by the end of 2009.
" 2008 stimulus - round two?
"The deeply disappointing retail sales report this week only serves to underscore how far behind the curve consumer is financially and a grim foreshadow of what lies ahead once the rebate checks are all spent. Flat spending was all consumers could muster in July with three quarters of the $106 billion total rebate checks in their bank accounts. We take consolation from the notion that the folks in the Beltway are doing the same math we are and thus the drumbeat of another round of stimulus is getting louder all the time.
" Housing still in the weeds
"The good news is that we're probably more than half way through the real estate correction. The bad news is that we've likely still got at least another 15% down on home prices to go before we reach bottom. Moreover, housing starts still need to breach the 700,000 mark to deal with the mountain of new and existing homes with for-sale signs on them. The supply situation will not be helped by the latest fractures in the mortgage securitization market, which will only slow the pace that homes can be sold and inventories can be cleared."
Below is a table with some of his forecasts. You can read the whole report at http://www.realclearmarkets. com/The%2520Market% 2520Economist%252007%252018% 252008.pdf .
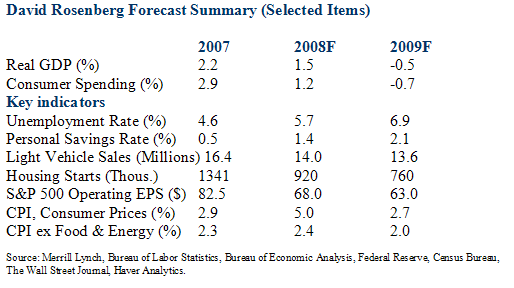
Can you say Muddle Through?
A Lean Mean Reversion Machine
Remember a few pages up when we were talking about the mean-reverting qualities of corporate earnings? If corporate earnings fell to their long-term average, that would mean a drop of about 50% from the peak, which would mean $45 in operating earnings, and even lower for reported earnings. You could easily see a P/E ratio north of 25 or 30 if the market did not move down. Quoting from another Rosenberg commentary:
"To put this into perspective, the four-quarter trailing EPS figure in the 2001 recession hit a trough of around $38; in the 1991 recession, the trough was just over $18. That means that we are not talking about Armageddon [projecting $45 earnings], but rather offering up some analysis highlighting the risks to the outlook. We will bottom at levels much higher than the troughs in the past; that is the good news. The not-so-good news is that the level of the S&P 500 in the past that tended to coincide with $45 earnings was right around the 1,000 mark; and if we were to slap on a typical trough multiple of 10-12x on that earnings stream, then ... well, you do the calculation."
I highlight this analysis because it illustrates the point I have been making for a long time. Recessions do ugly things to corporate bottom lines. They savage earnings, and that is what ultimately drives the stock market lower. For you to be bullish today, you have to believe that the recession is over and that earnings are going to rise, not fall.
A 15% drop from where we are today would not be out of historical character. It would be a merely average bear market in an average recession. Given the extremes to which profits rose in the last cycle, it would be strange indeed if they did not revert to the mean or go below. The Dow below 10,000 is not unrealistic, or the S&P below 1,000.
I clearly do not know the future, and the market does as much as possible to make me look bad. But I simply believe that the risk is to the downside. And if Rosenberg is anywhere near right, then it could get a lot worse. Continued earnings disappointments, combined with ever increasing write-offs implied by the S&P numbers, is not the environment for a renewal of the bull market. The current run-up is a bear market rally, in my opinion. It is a time to lighten up, if you have not already.
Some Thoughts on Energy Policy
The US Geological Survey said the Arctic may contain as much as 90 billion barrels of untapped crude oil and 1.67 quadrillion (with a "Q"!) cubic feet of natural gas. This is equal to approximately 13% of the world's undiscovered oil and 30% (!) of the undiscovered natural gas. There is yet more offshore oil and gas off the coasts of the US that is not being utilized. And that is assuming current technological methods. You have to know technology is going to improve recovery rates.
There are debates about energy policy, as to whether we should go to solar, wind, or bio-fuels, drill for more oil and gas, build 45 nuclear plants, etc. I don't get it. I would like to check a box that says all of the above.
The reality is that the world is going to demand more oil as the developing nations want more cars and energy. Oil production is declining in Mexico and Russia and other countries where we get our fuel. While proper drilling and better political climates could make up for declining production of older fields, it is not the long-term solution.
In the short term, we need to drill in the Arctic and offshore. Even though I am going to show why oil could go back to $100 in the near term, in the long term (3-5 years) it could easily go to $200 and $6 a gallon if we do not do something now, and maybe even if we do. It will take years for any oil or gas to come from offshore and Arctic sources. If we are going to have that energy in five years, we need to drill now.
And it can be done safely. A large portion of the oil and gas for the US comes from the offshore fields of Texas and Louisiana. There was a class 5 Hurricane Katrina which ripped through these offshore rigs a few years ago, and not one of them had even a minor environmental problem. These rigs are built solid and safe.
To drill in the Alaskan Natural Wildlife Arctic Reserve means drilling on a few square miles of land which is basically wasteland. No beautiful scenery. No tourists. Very few caribou. We have been drilling in Alaska for a long time without problems, and technology has improved.
Oil coming online in a few years will help hold down prices today. That is the way markets work. Every year we wait will mean higher prices and more money sent outside of the US. But drilling for oil is not the long-term solution.
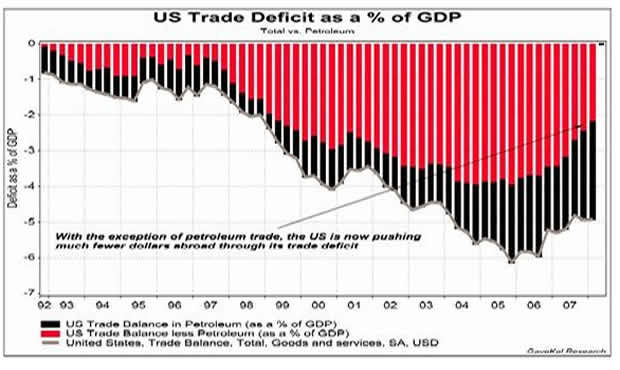
T. Boone Pickens has been running TV ads talking about a plan to divert natural gas to automobiles and reduce our need for oil. A key point is that we are sending $700 billion out of the US each year for oil. Over ten years it could be over $7 trillion. It is the largest transfer of wealth in history. It is unsustainable. It will be a serious drag on the dollar, which will make things even worse.
Look at this graph from my friends at GaveKal. It shows the US trade deficit, but the black shows the percentage of the deficit that is related to oil. Note how it has risen in the last few years, even as we have imported less in non-oil items. We have an oil deficit that is close to 3% of GDP, when ten years ago it was less than 0.5%. And the gap is rising as oil prices increase.
Pickens is a big proponent of wind power (and is putting his own money into wind, so he is "talking his book"). But there is a strong logic to what he says. Slowly converting our power grid to 15-20% wind (or even 5%) would be useful. You can see a quick presentation at YouTube: http://www.youtube.com/watch? v=Avt8Yo2WE14&feature=user
The July 21 Fortune has a great article on the rush to build solar power plants in the deserts of California, Arizona, and Nevada. Applications have been filed to build plants that would generate a theoretical 60 gigawatts of electricity. To put that into perspective, California only uses 33 gigawatts. And the biggest and richest firms are lining up to get land to build solar. These are not small start-ups. And that energy projection is using current technology, not even assuming what we will have in 5-10 years.
Note that California has over 10% of the population of the US, so there are people who actually want to use their money to build solar plants to provide 20% of the US demand for electricity. That is not a trivial pursuit.
Ironically, there are radical environmentalists who are planning to sue to stop this solar production because some desert animal's habitat might possibly be disturbed. Seriously? These are the people who think humans should leave the planet so that animals can live in peace and harmony with nature. And they are dictating our energy policy. Yes, we are talking about covering a great deal of uninhabitable desert with solar and thermal panels. And the government is taking its sweet time processing the applications. But we need to change the laws so that we can start the process. Allowing a few radical environmentalists to abuse the laws to prevent one of the best chances for renewable energy is just crazy.
You can read the well-written article by Todd Woody at http://greenwombat.blogs. fortune.cnn.com/2008/07/15/ the-solar-land-rush/ .
Senator John McCain wants to build 45 nuclear plants. Yes, that will take some time, but that means we need to start now. Within 15 years, and probably 10, our cars will be electric. We need to start building the power systems to meet increased demand for electric transportation.
And let's not forget clean coal technologies. All of the above can be done and still reduce our carbon footprint. But the point is that whoever gets elected next November needs to have a plan and put someone in place to actually lead and stop the bickering. It should not be either/or. It should be all of the above, because some of the ideas will not work out as predicted.
Either we are going to see the economic life sucked out of this country, or we can respond by doing everything that is in our power. There is not a shortage of energy. There is a shortage of leadership to produce the energy we need. A real energy policy would also have the benefit of boosting the beleaguered dollar.
T. Boone Pickens may be able to make energy policy the #1 election issue. And with another major effort by Pete Petersen, who is going to spend $1 billion telling the US how bad our Social Security and Medicare problems are before the election, maybe we can get enough people upset enough to demand some action. Maybe. Hopefully.
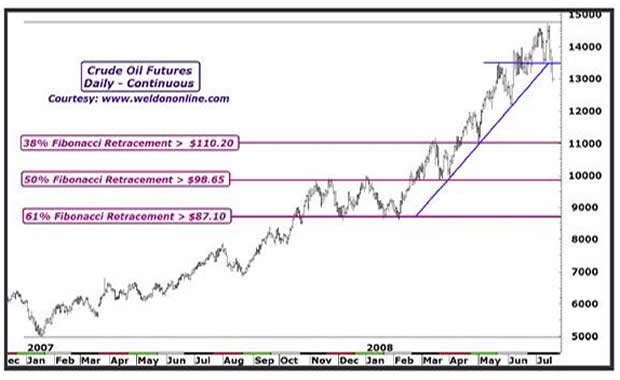
And speaking of the price of oil. It is $123, down from almost $150. Supplies are building and demand is being destroyed by high prices. Which of course reminds us that the cure for high prices is high prices.
How low could oil go? Data maven, uber trader, and good friend Greg Weldon recently developed a number of charts showing how supplies of oil-related products are rising and spreads are tightening. If we are in a correction, how low could oil go?
I must confess, I do not understand the fundamental aspect of something called a Fibonacci retracement, but the pattern keeps repeating itself over and over, so you have to pay attention. These are numbers based on work done by Leonardo Fibonacci in the 1200s. Basically, when a market starts to correct, it tends to go to certain points for support. Traders use them so much that they become psychologically important, which may be why they are useful.
Look at the chart below. It shows that if oil goes to its Fibonacci retracement levels, it could drop to $110 or below $100. That would not, as Greg notes, violate the longer-term bull market trend, but it could be seen as a normal correction. Just food for thought.
Oregon, Maine, and a Wedding
Tomorrow I fly out for a meeting in Portland, Oregon and back on a ridiculously early flight Tuesday morning. (What was I thinking?) And then Thursday I fly to Maine for David Kotok's Annual Shadow Fed Fishing Event. My youngest son Trey (now 14) and I fly to Bangor and then take a float plane to Leen's Lodge to meet with 30+ people. There will be several Fed economists, and some well-known names like Paul McCulley of Pimco, Martin Barnes of Bank Credit Analyst, Barry Ritholtz, John Silvia of Wachovia, and some very sharp traders and analysts. Right now, Steve Leesman of CNBC and a crew are slotted to come in, or so I am told. Everyone basically ships in a case of their favorite wines, so it is a very fun event. I can tell you that some of the participants go all out in their choice of wine, and I look forward to tasting scores of different wines.
But the conversation and comradery are the best part. We get up every morning and go out on the lake with local guides to fish, then meet for lunch on an island, eat what we caught, talk shop, tell lies, and drink lots of wine. Then we go out again and come back for a gourmet dinner, and drink even more wine and maybe some of Martin's Scotch. Then get up and do it again. And repeat. And the best part for Trey is that he always seems to catch twice as many fish as I do, as well as the biggest.
On Saturday night, everyone gathers in the lodge to place small bets (typically $10) on where the markets will be one year hence. Last year I asked those of my readers who wanted to, to also make predictions. We will go back this week and see how you did, and the best will be sent a copy of some book that I like. (Besides one of mine. Though I assume you already have those.) And I already know I have won one bet, so I will be a winner again this year. It will be interesting to see how close I came in the other bets. I will write this up in a later letter.
And then I come back for Wedding Week. The wedding is August 8. I spent Thursday with Tiffani and Ryan, meeting with wedding planners, musicians, caterers, fireworks managers (sigh), and a legion of people coordinating an event that has grown beyond the original vision. But what fun. And to see your daughter so happy? Priceless.
The weeks seem to go by so fast this summer, and now it is late and time to hit the send button. Have a great week.
Your hoping he can catch more fish this year analyst,
By John Mauldin
John Mauldin, Best-Selling author and recognized financial expert, is also editor of the free Thoughts From the Frontline that goes to over 1 million readers each week. For more information on John or his FREE weekly economic letter go to: http://www.frontlinethoughts.com/learnmore
To subscribe to John Mauldin's E-Letter please click here:http://www.frontlinethoughts.com/subscribe.asp
Copyright 2008 John Mauldin. All Rights Reserved
John Mauldin is president of Millennium Wave Advisors, LLC, a registered investment advisor. All material presented herein is believed to be reliable but we cannot attest to its accuracy. Investment recommendations may change and readers are urged to check with their investment counselors before making any investment decisions. Opinions expressed in these reports may change without prior notice. John Mauldin and/or the staff at Millennium Wave Advisors, LLC may or may not have investments in any funds cited above. Mauldin can be reached at 800-829-7273.
Disclaimer PAST RESULTS ARE NOT INDICATIVE OF FUTURE RESULTS. THERE IS RISK OF LOSS AS WELL AS THE OPPORTUNITY FOR GAIN WHEN INVESTING IN MANAGED FUNDS. WHEN CONSIDERING ALTERNATIVE INVESTMENTS, INCLUDING HEDGE FUNDS, YOU SHOULD CONSIDER VARIOUS RISKS INCLUDING THE FACT THAT SOME PRODUCTS: OFTEN ENGAGE IN LEVERAGING AND OTHER SPECULATIVE INVESTMENT PRACTICES THAT MAY INCREASE THE RISK OF INVESTMENT LOSS, CAN BE ILLIQUID, ARE NOT REQUIRED TO PROVIDE PERIODIC PRICING OR VALUATION INFORMATION TO INVESTORS, MAY INVOLVE COMPLEX TAX STRUCTURES AND DELAYS IN DISTRIBUTING IMPORTANT TAX INFORMATION, ARE NOT SUBJECT TO THE SAME REGULATORY REQUIREMENTS AS MUTUAL FUNDS, OFTEN CHARGE HIGH FEES, AND IN MANY CASES THE UNDERLYING INVESTMENTS ARE NOT TRANSPARENT AND ARE KNOWN ONLY TO THE INVESTMENT MANAGER.
John Mauldin Archive |
© 2005-2022 http://www.MarketOracle.co.uk - The Market Oracle is a FREE Daily Financial Markets Analysis & Forecasting online publication.