Gold Hit by Crude Oil Sell Off, Technicals Still Bullish
Commodities / Gold & Silver Jul 27, 2008 - 04:10 PM GMTBy: Clive_Maund

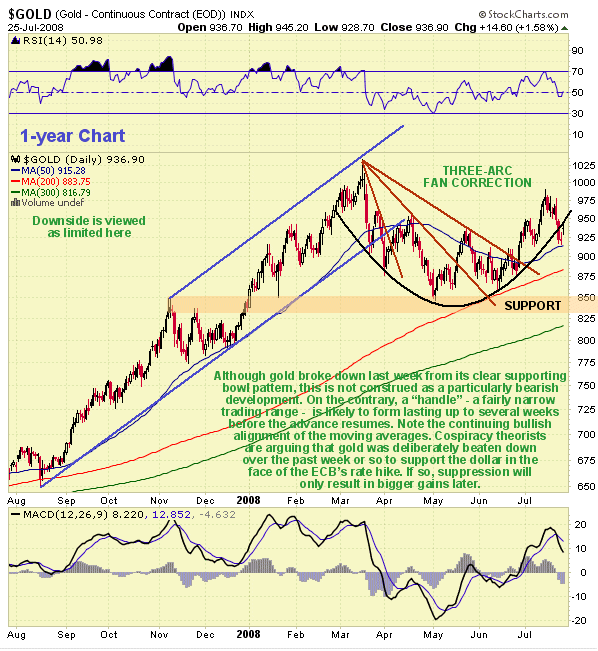
 While the broad stockmarket has staged a relief rally from deeply oversold in response to the Fannie and Freddie bailout and oil has tumbled over the past week or two, both as predicted, gold has suffered more collateral damage than expected from these factors resulting in quite heavy losses in the Precious Metals sector. Conspiracy theorists are arguing that gold was deliberately targeted in order to help protect the dollar at a time when it is especially vulnerable due to the European Central Bank raising rates.
Whatever the truth of this the magnitude of the decline in gold was not actually that great as we will shortly see when we examine the chart, while the danger to the dollar has certainly not been mitigated - on the contrary it has gotten worse.

On the 1-year chart we can see that gold last week broke down from the supporting bowl pattern that had recently propelled it to 3-month highs. At first sight this might be viewed as a bearish development, but what commonly happens with these cup and bowl patterns is that a "handle" forms after such a breakdown. This involves the price breaking down or sideways out of the bowl after first ascending higher at the right side of it - a development that can de disconcerting to inexperienced traders.
What then typically happens is that the price tracks sideways for a while in a relatively narrow range forming a "handle" proportionate to the cup or bowl preceding it before the advance resumes. This is what we can now expect to occur with gold. All moving averages are in bullish alignment and downside is viewed as limited here. So gold is now expected to track sideways for between several weeks and perhaps up to 5 or 6 weeks between approximately the current price and the highs, before it breaks out to new highs.

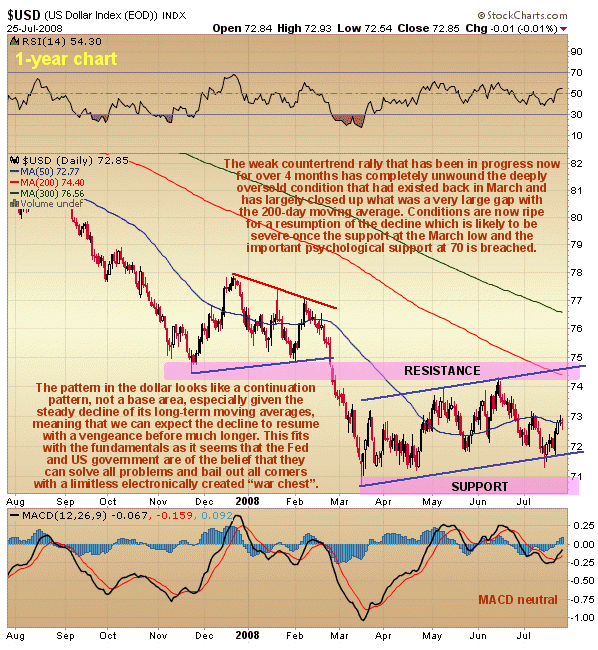
On the 1-year dollar chart we can that last week`s rally changes nothing. After looking like it was breaking down, the dollar snook back into the weak countertrend channel in force from mid-March and in so doing bought a little more time, but as we can see the steadily falling long-term moving averages drawing closer overhead look set to drive it lower before much longer. This fits with the fundamentals where the US Fed and the US government have made it clear with their recent actions in respect to Fannie and Freddie, and before that Bear Stearns via J P Morgan, that the largest hogs will be able to push their snouts squarely into the trough, so that their ears are flapping above their eyes, assured that the faucet will be kept wide open with a limitless supply of electronically created feed.
In other words, if they are big enough to bring down the system down should they fail, they will be hooked up to the "taxpayer life-support system", socialist style, regardless of whether they end up nearly killing their hosts. This is what is meant by the term "too big to fail". What this must inevitably mean is a lot more dollars flying around, as if there aren't enough already, and alot more inflation, neither of which are renowned for causing the price of gold to fall.
By Clive Maund
CliveMaund.com
For billing & subscription questions: subscriptions@clivemaund.com
© 2008 Clive Maund - The above represents the opinion and analysis of Mr. Maund, based on data available to him, at the time of writing. Mr. Maunds opinions are his own, and are not a recommendation or an offer to buy or sell securities. No responsibility can be accepted for losses that may result as a consequence of trading on the basis of this analysis.
Mr. Maund is an independent analyst who receives no compensation of any kind from any groups, individuals or corporations mentioned in his reports. As trading and investing in any financial markets may involve serious risk of loss, Mr. Maund recommends that you consult with a qualified investment advisor, one licensed by appropriate regulatory agencies in your legal jurisdiction and do your own due diligence and research when making any kind of a transaction with financial ramifications.
Clive Maund Archive |
© 2005-2022 http://www.MarketOracle.co.uk - The Market Oracle is a FREE Daily Financial Markets Analysis & Forecasting online publication.


