USD, Gold and USB are testing their Outer Limits
Stock-Markets / Financial Markets 2016 Oct 05, 2016 - 10:36 AM GMT USD came within a hair’s breadth of the upper Broadening Wedge trendline at 96.50 this morning, but now is beginning to sell off after reaching 96.39. Considering the corrective nature of the move, I did not expect the trendline to be broken. Nonetheless, I had monitored it for any unexpected outcome. A decline today beneath 95.26 may create a Bearish Engulfing Candle, which is a strong reversal pattern.
The moves being made here may have a pronounced effect on various markets, which we will discuss further down the page. The main effect of a declining USD may be the withdrawal of foreign investors from risk markets.
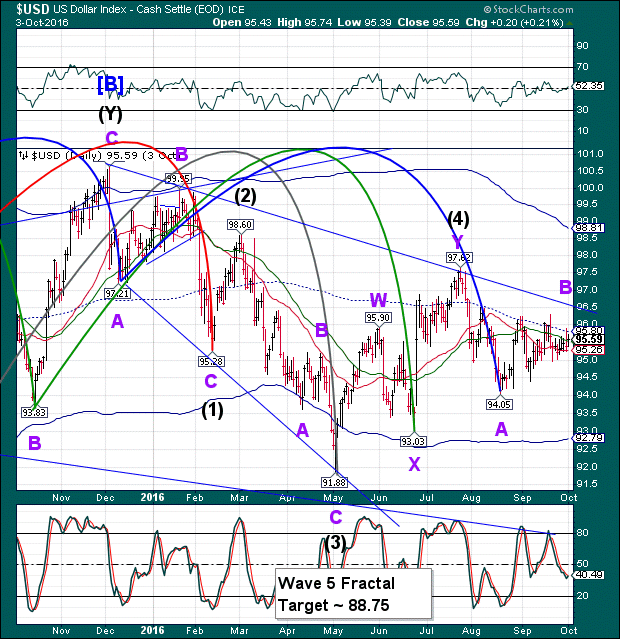
I am reluctant to call this most recent Minor Wave B formation a Triangle, though many have. If its were, it would still fit within a B Wave.
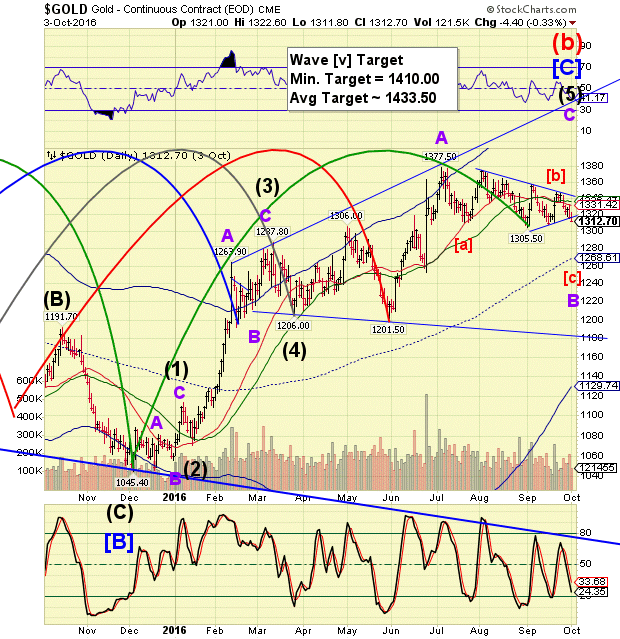
We may be seeing the same phenomenon in gold. Although irregular, it still fits within the parameters of a Minute Wave [b]. Note that the sub-minute Wave (b) of that formation appears also to have a triangle within it. This would be notated as [a-Triangle b-c] of sub-minute Wave (b) of a Minute Wave [b] of a Minor Wave B. Wave B’s are rogue Waves, which lead many speculators astray. It has now turned gold speculators bearish just before a powerful rally.
Gold has extended its decline to 1269.00 as I write. The support at hand is the mid-cycle support at 1268.61. That would be a fitting end to Minute Wave [c] of Minor Wave B. Wave [c] may challenge the support line, but should reverse fairly quickly, considering that the USD may have already made its reversal.
The Cycles Model suggests Gold is going into a period of strength until at least October 10.
While gold peaked on July 6, USB peaked only 2 days later on July 8. There appears to be a strikingly similar pattern as USB is testing its mid-Cycle support and trading channel trendline at 166.40 today. This also lends credence to the probability of a smart rally off that support area (Wave [iii] of C).
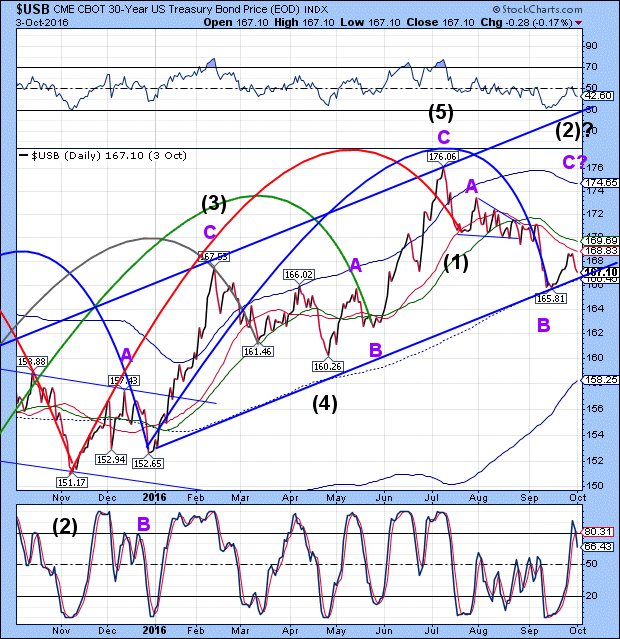
While I am expecting Gold to go higher, I am still questioning the ability of USB to make a new high. The Wave structure suggests a probable Expanded Flat Wave (2) which may end at or near the Cycle Top resistance at 174.65. However, we can adjust my attitude as USB gains altitude.
The Cycles Model suggests that USB is going into a period of strength until the end of October or early November.
Meanwhile, SPX is just starting to lose altitude as it has crossed Short-term support at 1256.46. The Cycles Model now suggests Monday, October 10 as the earliest day for a low. I suggests a window for the low that may extend as far as October 18, two weeks beyond the normal Master Cycle low date, which is today. Remember, the last Master Cycle low was September 12, but was due on August 29, 15 days earlier. This also leads me to believe that the last Master Cycle low of the year, due on October 26, may also come up to 2 weeks later.
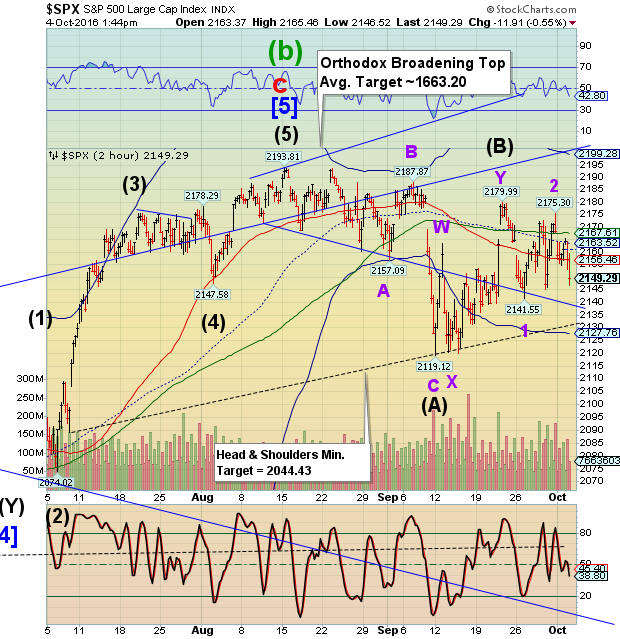
Thank you, central banks for delaying the inevitable (and possibly making it worse).
VIX has broken out against its most recent high and is now on a confirmed buy (SPX sell) signal.
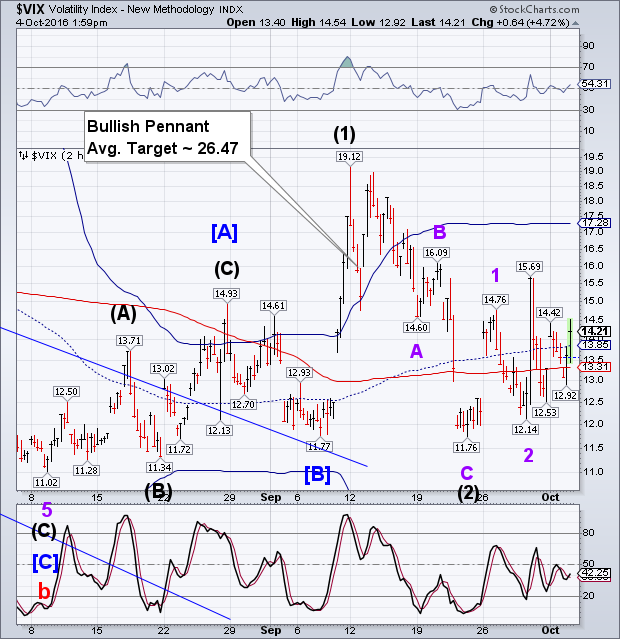
ZeroHedge is raising a certain amount of umbrage with this missive, “Seriously...
Does this look normal in any way to anyone? No news, no headlines...
With Deutsche bank CDS hitting record highs, US equity markets are turmoiling as VIX-stomping efforts to 'maintain wealth' are failing...”
Earlier today, VIX was smashed to rescue stocks from a Dollar-driven plunge.
Can someone tell the planners it isn’t working anymore?
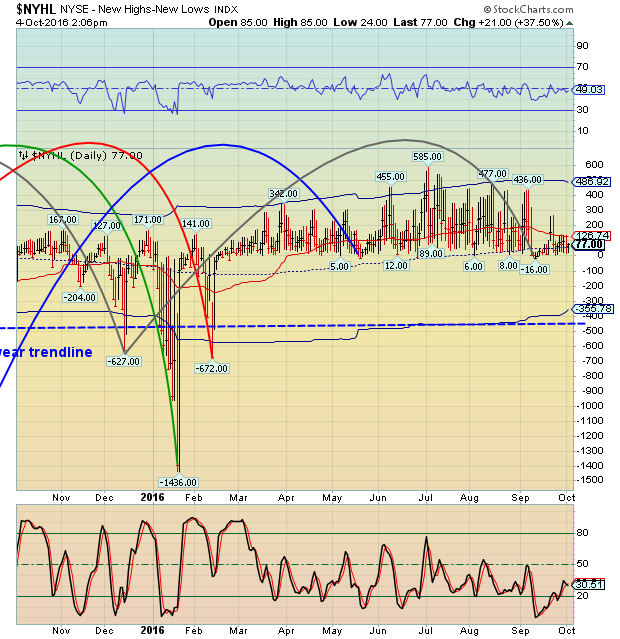
The NYSE Hi-Lo Index has remained under its 50-day Moving Average since the September 22 peak. It brings the 50-day back into play as a buy-sell indicator. Nonetheless, the Hi-Lo has not closed beneath its mid-Cycle support at 65.57. This leaves the Hi-Lo on an aggressive sell until it closes beneath the mid-Cycle support.
Good luck and good trading!
Regards,
Tony
Our Investment Advisor Registration is on the Web.
We are in the process of updating our website at www.thepracticalinvestor.com to have more information on our services. Log on and click on Advisor Registration to get more details.
If you are a client or wish to become one, please make an appointment to discuss our investment strategies by calling Connie or Tony at (517) 699-1554, ext 10 or 11. Or e-mail us at tpi@thepracticalinvestor.com .
Anthony M. Cherniawski, President and CIO http://www.thepracticalinvestor.com
As a State Registered Investment Advisor, The Practical Investor (TPI) manages private client investment portfolios using a proprietary investment strategy created by Chief Investment Officer Tony Cherniawski. Throughout 2000-01, when many investors felt the pain of double digit market losses, TPI successfully navigated the choppy investment waters, creating a profit for our private investment clients. With a focus on preserving assets and capitalizing on opportunities, TPI clients benefited greatly from the TPI strategies, allowing them to stay on track with their life goals.
Disclaimer: The content in this article is written for educational and informational purposes only. There is no offer or recommendation to buy or sell any security and no information contained here should be interpreted or construed as investment advice. Do you own due diligence as the information in this article is the opinion of Anthony M. Cherniawski and subject to change without notice.
Anthony M. Cherniawski Archive |
© 2005-2022 http://www.MarketOracle.co.uk - The Market Oracle is a FREE Daily Financial Markets Analysis & Forecasting online publication.


