


Breakdown and Slide in Crude Oil Price
Commodities / Crude Oil Nov 30, 2016 - 12:17 PM GMTBy: Nadia_Simmons

 Trading position (short-term; our opinion): No positions are justified from the risk/reward perspective.
Crude oil gained 2.21% yesterday and came back above $47, but taking a dive today, confirming that closing the long positions yesterday and taking profits off the table was a good idea. Now, the question is how much does today’s decline actually change.
Let’s take a look at the charts to find out (charts courtesy of http://stockcharts.com).
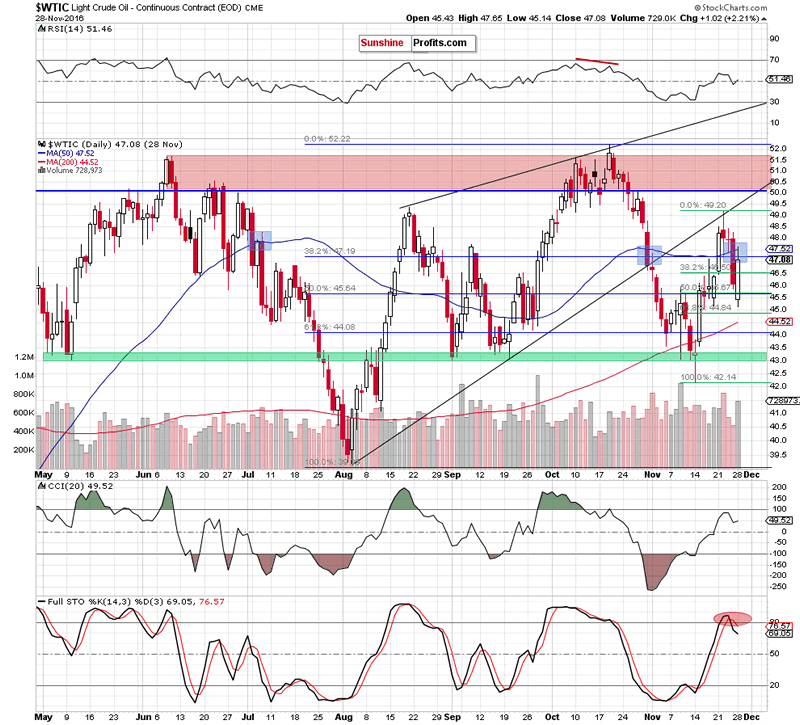
Looking at the daily chart, we see that crude oil bounced off the mid-Now lows and climbed above $47, reaching the previously-broken 50-day moving average. We saw similar situation at the beginning of Jul and at the turn of Oct and Nov. In both previous cases, verification of breakdowns preceded further declines, which increases the probability of the realization of our yesterday's outlook:
(…) With Friday’s decline, the commodity also slipped below the 50-day moving average and Fibonacci levels, which doesn’t bode well for light crude – especially when we factor in a sell signal generated by the Stochastic Oscillator. Taking all the above-mentioned negative factors into account, it seems that crude oil could extend losses and even a test the previously-broken 200-day moving average in the coming days.
With the outlook being rather bearish despite yesterday’s upswing, it is quite natural to view today’s decline as a confirmation. Besides, the bearish scenario is also supported by the current situation in the oil-to-gold ratio.
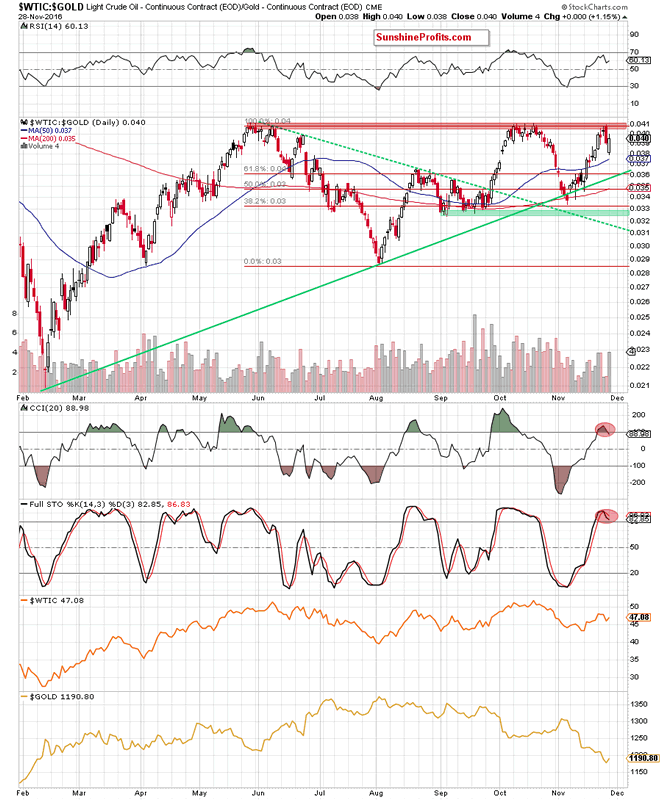
From this perspective, we see that the ratio reached the key red resistance zone, which stopped increases in Oct. This area triggered also a pullback on Friday, which in combination with sell signals generated by the CCI and Stochastic Oscillator suggests that lower values of the ratio (and crude oil as strong positive correlation remains in play) are just around the corner.
Summing up, although crude oil rebounded yesterday, the 50-day moving average stopped further improvement, which in combination with a sell signal generated by the Stochastic Oscillator and the current situation in the oil-to-gold ratio suggests that we’ll see another attempt to move lower and even a test the 200-day moving average in the coming days. For now, it seems that keeping the profits from the previous trades intact and waiting for another trading opportunity is justified from the risk to reward point of view.
Very short-term outlook: mixed
Short-term outlook: mixed
MT outlook: mixed
LT outlook: mixed
Trading position (short-term; our opinion): No positions are justified from the risk/reward perspective.
Thank you.
Nadia Simmons
Forex & Oil Trading Strategist
Przemyslaw Radomski
Founder, Editor-in-chief
Sunshine Profits: Gold & Silver, Forex, Bitcoin, Crude Oil & Stocks
Stay updated: sign up for our free mailing list today
* * * * *
Disclaimer
All essays, research and information found above represent analyses and opinions of Nadia Simmons and Sunshine Profits' associates only. As such, it may prove wrong and be a subject to change without notice. Opinions and analyses were based on data available to authors of respective essays at the time of writing. Although the information provided above is based on careful research and sources that are believed to be accurate, Nadia Simmons and his associates do not guarantee the accuracy or thoroughness of the data or information reported. The opinions published above are neither an offer nor a recommendation to purchase or sell any securities. Nadia Simmons is not a Registered Securities Advisor. By reading Nadia Simmons’ reports you fully agree that he will not be held responsible or liable for any decisions you make regarding any information provided in these reports. Investing, trading and speculation in any financial markets may involve high risk of loss. Nadia Simmons, Sunshine Profits' employees and affiliates as well as members of their families may have a short or long position in any securities, including those mentioned in any of the reports or essays, and may make additional purchases and/or sales of those securities without notice.
© 2005-2022 http://www.MarketOracle.co.uk - The Market Oracle is a FREE Daily Financial Markets Analysis & Forecasting online publication.