


Maps That Explain US Main Economic Strength Over Russia
Politics / GeoPolitics Dec 12, 2016 - 05:15 PM GMTBy: John_Mauldin

 BY JACOB L. SHAPIRO : Power is a relative concept. To say one nation is powerful means nothing. Power derives meaning only when assessed in comparison.
Two nations whose powers we constantly reevaluate are Russia and the United States. Much of our analysis is driven by how weak we believe the Russian Federation is.
There are different ways to evaluate this. Comparing US and Russian regional economies is particularly striking.
First, we see how much larger the US economy is than Russia’s. Russia is the largest country in the world in terms of area. Almost 11% of the world’s landmass is sovereign Russian territory. But Russia’s economy pales when compared to the US’.
According to 2016 first-quarter figures from the US Commerce Department, US GDP is around $18.1 trillion. Russia’s economy is roughly a tenth of that size. Russia’s GDP in 2015 was $1.3 trillion.
Russia’s regional contributions
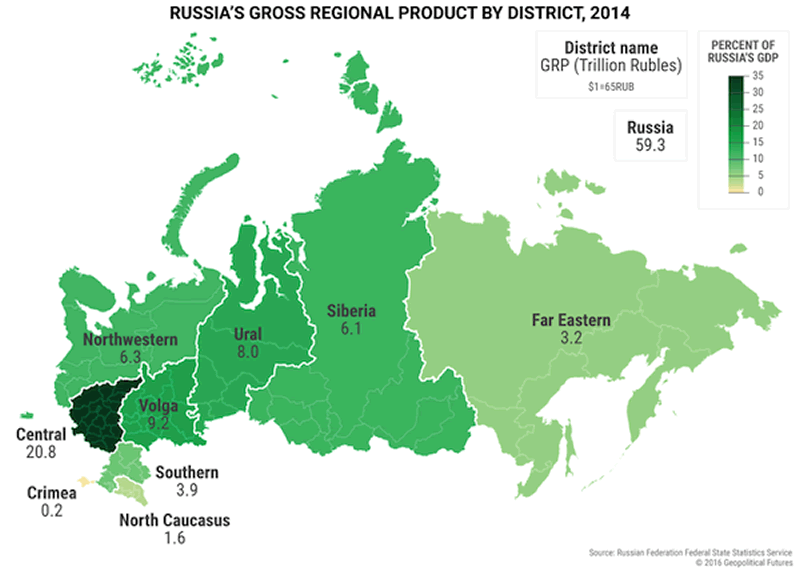
One of the results of Russia’s physical size is a highly regionalized economy, as the map above shows. Russia is a collection of 85 federal subjects ranging from autonomous regions and republics to cities. For governing purposes, Russia divides these 85 regions into nine larger districts.
The above map shows how much of the GDP each Russian region contributes. The figures are noteworthy.
According to the Federal State Statistical Service, the Central Federal District accounts for 35% of the entire Russian economy. Located in this district, Moscow alone accounts for 21.7% of the entire economy. Russia’s capital city accounts for more of the Russian economy than any single region in the US adds to the US GDP.
We recently have focused on regional economic problems in Russia. The above map helps explain why.
The regime that rules from Moscow has a great deal of wealth in absolute terms. But it is not enough to govern the rest of Russia without a firm grip that must tighten as Russia burns through reserves and cuts social spending.
A union of states
The US is roughly half the size of Russia in area. But it still is large compared to most other countries. The US is also a federation, with 50 states having different economic interests. States in the union always have been more linked than Russia’s disparate regions.
Russia’s population clusters along its western border with Europe and its southern border with the Caucasus. All of its rivers and infrastructure point west. That is why much of Russia’s economy is concentrated in one area.
The US population is increasingly concentrated on coasts and in urban centers. But the country’s internal circulatory system since 1803 has been the Mississippi River. Its vast and navigable water system explains why the economies of various states have developed as they have.
Washington and Moscow
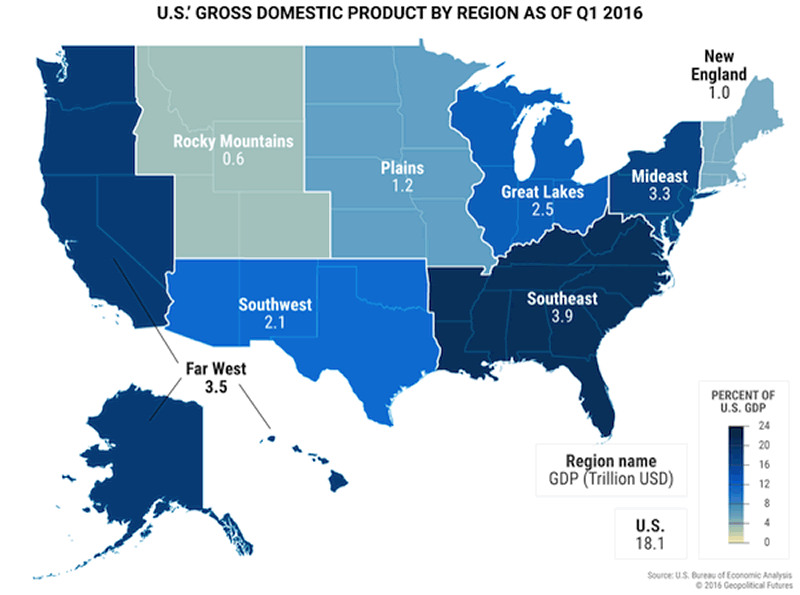
Like Russia, the US is divided into nine regions for bureaucratic purposes. What stands out in the map above is that while the US has regions accounting for a greater share of the US economy, overall, economic activity is much more spread out than in Russia.
Almost every US region has a major state economy. In Russia, the Central Federal District and a few far-flung oil-producing regions produce the country’s wealth. In the US, wealth is more spread out.
The Southeast region contributes the most to total GDP. The Mideast and the Far West are not far behind. New York City is the US’ largest city. Its greater metropolitan area supplies about 7% of the country’s total GDP. That pales compared to the outsized role Moscow plays in Russia’s economy.
California, Texas, and New York have the biggest state economies. And they are located about as far away from each other as they can be. They are engines for regional economies and important contributors to the national economy.
But the situation is not perfect. The Rocky Mountains region is the least important in terms of the economy. It represents just 3.4% of the country’s total GDP.
The US economy is less dependent on government handouts from Washington than Russia’s various regions are dependent on Moscow money.
Carrot and stick
All national economies are regionalized at some level. But broad patterns of regionalization can reveal much about a country’s economic structure and relative power.
This lens allows us to see how concentrated the wealth is in the Russian Federation. That puts a great deal of strain on one district, and the capital city in particular. As a result, Russia must find a balance of carrot and stick to rule a vast territory at a time when its chief moneymaker—oil exports—is less profitable than expected.
US wealth, on the other hand, is spread out much more evenly between various regions. That means the US economy is far more dependent on regional economic centers than on decisions in Washington. This is a source of power for the country.
Prepare Yourself for Tomorrow with George Friedman’s This Week in Geopolitics
This riveting weekly newsletter by global-intelligence guru George Friedman gives you an in-depth view of the hidden forces that drive world events and markets. You’ll learn that economic trends, social upheaval, stock market cycles, and more… are all connected to powerful geopolitical currents that most of us aren’t even aware of. Get This Week in Geopolitics free in your inbox every Monday.
John Mauldin Archive |
© 2005-2022 http://www.MarketOracle.co.uk - The Market Oracle is a FREE Daily Financial Markets Analysis & Forecasting online publication.