


2017: Year of Market and Economic Extremes
Stock-Markets / Financial Markets 2017 Jan 11, 2017 - 06:40 PM GMTBy: Clif_Droke

 Now that another New Year is upon us, it's time to reflect on what the coming months might unfold. Normally when market analysts try their hand at predicting the year ahead it involves either wild guessing or linear extrapolation based on prevailing trends. I tend to eschew both methods and instead focus on comparing past events in comparable time frames. This method is based on something known as Kress cycle "echo" analysis and was pioneered by my late mentor, Samuel J. Kress.
The year 2016 was filled with ups and downs, but was mainly a torpid year with stock prices stuck in a dull trading range for much of the spring and summer. It continued a theme of directionless and no progress from the prior year, which, combined with the after-effects of the preceding slow-growth years, culminated in a disaffected mindset on the part of the masses. The result was clearly seen in the outcome of the 2016 U.S. presidential election.
One of the most reliable of the long-term market rhythms (or "echoes") is the 10-year (decennial) pattern. This is often erroneously referred to as a "cycle" despite not fitting the technical definition of one. The 10-year rhythm was famously expounded by the late market analyst Edson Gould and by Edgar Lawrence Smith in his book, Tides in the Affairs of Men.
The seventh year of the decade tends to be tempestuous and often sees extraordinary volatility. It's a year filled with extreme ups and downs and not uncommonly witnesses both a major high and a major low within the year. In recent decades, the seventh year has witnessed the market making impressive strides, yet not without its share of turmoil. Crashes, mini-crashes and panics are quite common in the seventh year (e.g. September 1987, October 1997, February/August 2007). It will do us well to keep this in remembrance as we enter what promises to be a year filled with tremendous opportunity for making money in the stock market - in both directions.
For 2017, the 10-year rhythm equates to 2007. As you recall, 2007 was a momentous year characterized at once by great volatility alternating between great fear and euphoria. It was the year that saw the last major stock market top and also the onset of the credit tsunami which overwhelmed the market the following year. If the decennial pattern holds true, 2017 should witness both a meaningful rally to new all-time highs as well as a decline of potentially major proportions later in the year. In short, it could turn out to be a big year for the bulls as well as the bears.
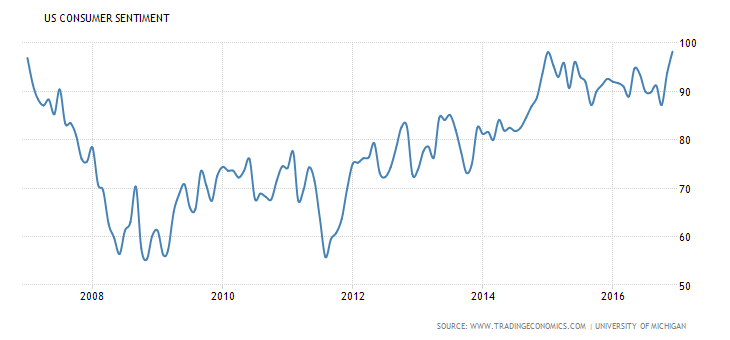
Now what about the economy in the coming year? Year 2016 ended on a positive note, with the last meaningful economic news in late December being the revelation that U.S. consumer confidence had hit a 15-year high. The Consumer Confidence Index hit 113.7 in December, exceeding economists' expectations of a 109 reading. The reading was the highest since August 2001. Rising sentiment among consumers implies an optimistic economic outlook in the wake of Donald Trump's election win. The following graph is courtesy of the Trading Economics website (www.tradingeconomics.com).
For many in the middle class, Trump's win has provided a reason for genuine hope for the first time in years. Whether this hope will ever be fulfilled is a matter for conjecture. What's important from a market perspective is how consumers and investors respond to that hope. To that end the appropriate question to ask is, "Will 2017 be the year that retail investors finally return from the sidelines?"
For the year-seven decennial pattern to repeat, as it has in the three prior decades there must be not only a continuation of rising consumer confidence, but an acceleration in investor optimism as well. To this end, it would seem necessary that small investors return from the sidelines and put their money back into the stock market. After years of being stuck in the bomb shelter of low-yielding bonds, this important group of participants is no doubt feeling the urge to grow their money.
To that end, the stock market is beckoning to them - especially with so many major indices at or near all-time highs. The fact that the man who they believe represents their interests as an economic class will be in the White House will serve to stimulate their confidence in the economic outlook. History shows that when consumers feel good about their intermediate-term economic prospects they are more likely to invest in stocks.
Here is what investor sentiment currently looks like according to the Rydex Ratio of investor sentiment. We should ideally see a major spike higher in this ratio sometime this year, ideally by late summer, to let us know that the historical pattern for Year Seven is on track for being repeated.
Whether or not 2017 will prove to be the exception to the "rules" of the decennial "echo" established in the prior decades remains to be seen. We are certainly living in exceptional times, so it's possible that 2017 will in effect throw the historical playbook out the window. But as the last several years have resonated to the tune of the Kress cycle echoes to some degree or other, I have to assume that there will be at least some validity to the decennial rhythm for 2017. Remember, while history doesn't always repeat it does usually rhyme.
Mastering Moving Averages
The moving average is one of the most versatile of all trading tools and should be a part of every investor's arsenal. Far more than a simple trend line, it's also a dynamic momentum indicator as well as a means of identifying support and resistance across variable time frames. It can also be used in place of an overbought/oversold oscillator when used in relationship to the price of the stock or ETF you're trading in.
In my latest book, Mastering Moving Averages, I remove the mystique behind stock and ETF trading and reveal a simple and reliable system that allows retail traders to profit from both up and down moves in the market. The trading techniques discussed in the book have been carefully calibrated to match today's fast-moving and sometimes volatile market environment. If you're interested in moving average trading techniques, you'll want to read this book.
Order today and receive an autographed copy along with a copy of the book, The Best Strategies for Momentum Traders. Your order also includes a FREE 1-month trial subscription to the Momentum Strategies Report newsletter: http://www.clifdroke.com/books/masteringma.html
By Clif Droke
www.clifdroke.com
Clif Droke is the editor of the daily Gold & Silver Stock Report. Published daily since 2002, the report provides forecasts and analysis of the leading gold, silver, uranium and energy stocks from a short-term technical standpoint. He is also the author of numerous books, including 'How to Read Chart Patterns for Greater Profits.' For more information visit www.clifdroke.com
Clif Droke Archive |
© 2005-2022 http://www.MarketOracle.co.uk - The Market Oracle is a FREE Daily Financial Markets Analysis & Forecasting online publication.