Stock Market Dow 20,000: A New Beginning...or The Beginning of The End?
Stock-Markets / Stock Market 2017 Jan 19, 2017 - 04:15 PM GMTBy: Clif_Droke
 After touching the benchmark 20,000 level last month, the Dow Jones Industrial Average has spent the last five weeks in a tight, narrow trading range just under this level. Famed trader Jesse Livermore theorized in his pseudonymous book, Reminiscences of a Stock Operator, that stocks are attracted to major round number levels. In the case of the Dow, the 20,000 level has generated more press and speculation among investors than any number since the formerly mythical 10,000 level was crossed in 1999. Clearly Dow 20,000 carries a tremendous psychological significance, even if it's a simple case of self-fulfilling prophecy.
While the technical significance of Dow 20,000 can be endlessly debated, the action of the Industrials in the weeks following the first test of this level is of more immediate concern. To wit, does the action of the last several weeks represent a normal consolidation (i.e. a "pause that refreshes"), or is it indicative of distribution (i.e. informed selling)? The NYSE tape doesn't suggest distribution since the new 52-week high-low differential has been mostly healthy in the last few weeks while market breadth has also been confirming, and in some cases leading, the advance.
It's possible, however, that the extended effort to push above Dow 20,000 could be the prelude to a distribution phase. In an earlier commentary we discussed the distinct possibility – based on the "echo" of the 10-year cycle – that the coming months could witness a blow-off interim top, followed by significant decline at some point later in the year. Historically such declines have occurred in the late summer/early fall months, particularly in the seventh year of the decennial rhythm.
A run-up above the Dow 20,000 level, should it occur, would undoubtedly generate lots of enthusiasm among the hold-outs in the retail investor camp. There's still a huge amount of money on the sidelines right now with small investors still skittish about buying stocks at current valuations. But greed is a persuasive argument, and if the Dow breaks out decisively above 20,000 in the coming weeks it would serve as a magnet for sidelined money. One thing that investors can't stand more than anything else is watching an historic rally while they're sitting in cash and not participating. A breakout above 20,000 would likely trigger the primal instincts of these non-participants.
Although the 20,000 level carries great psychological significance its technical significance hasn't yet been cemented. In order for 20,000 to become technically significant it must be established as a "seldom crossed line." A seldom crossed line is a concept developed by the late market technician P.Q. Wall. Wall emphasized that when an individual stock or market index crossed an important price level only a few times in its history, the level takes on added significance as both a support and resistance level. He wrote:
"If cycles exist at all there must by that very fact be equidistant lines of price on a vertical scale that rise as more energy enters the market. These should be seldom crossed lines between which price tends to cluster about equilibrium points that mathematicians would call strange attractors but that we call magnetic midpoints....Electrons in an atom rise and fall in just such stair steps."
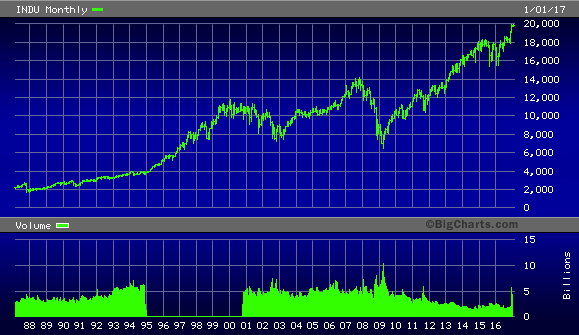
Take for example the chart of the Dow Industrials shown below. While many investors touted Dow 10,000 as a critical level back in the late ‘90s and early 2000s, that particular level was actually crossed many times on both the upside and the downside. By Wall's reckoning, this invalidated the 10,000 level as having major significance as a long-term support or resistance level – as history subsequently proved.

Wall believed that when a stock's price encountered resistance at a key level without breaking above it then finally succeeded in breaking out the rally that followed would be noteworthy. For the Dow, the closest thing to a seldom crossed line is the 14,000 level. This was established as a pivotal level when the Dow broke out above it in 2013, then proceeded to rocket all the way to the 18,000 level before wavering. In the future, any major decline that tests 14,000 is likely to be turned back due to the established technical significance of this level.
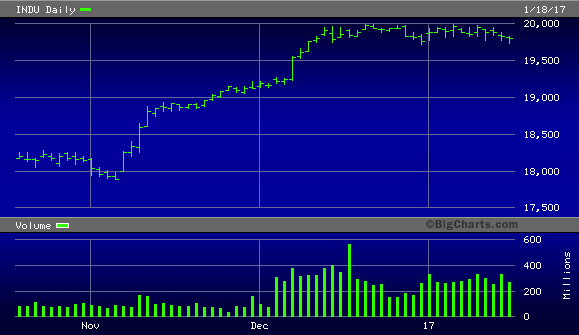
As for Dow 20,000 you can see in the following snapshot of the last three months' worth of trading action that the level in question hasn't been penetrated on the upside yet. This is an important first step toward the establishment of a seldom crossed line. The Dow has yet to lay claim to this important designation of the 20,000 level, however. The key ingredient here is time and the reaction of the Dow's price line to this pivotal level in the coming days.

If Dow 20,000 turns out to be a seldom crossed line then the next attempt at breaking above this level should see an explosive rally with no immediate reversal. In other words, it should cross above 20,000 only once and not look back for a while. Accordingly, the next few weeks should be quite interesting and potentially historic depending on how the market behaves once 20,000 is finally crossed.
Mastering Moving Averages
The moving average is one of the most versatile of all trading tools and should be a part of every investor's arsenal. Far more than a simple trend line, it's also a dynamic momentum indicator as well as a means of identifying support and resistance across variable time frames. It can also be used in place of an overbought/oversold oscillator when used in relationship to the price of the stock or ETF you're trading in.
In my latest book, Mastering Moving Averages, I remove the mystique behind stock and ETF trading and reveal a simple and reliable system that allows retail traders to profit from both up and down moves in the market. The trading techniques discussed in the book have been carefully calibrated to match today's fast-moving and sometimes volatile market environment. If you're interested in moving average trading techniques, you'll want to read this book.
Order today and receive an autographed copy along with a copy of the book, The Best Strategies for Momentum Traders. Your order also includes a FREE 1-month trial subscription to the Momentum Strategies Report newsletter: http://www.clifdroke.com/books/masteringma.html
By Clif Droke
www.clifdroke.com
Clif Droke is the editor of the daily Gold & Silver Stock Report. Published daily since 2002, the report provides forecasts and analysis of the leading gold, silver, uranium and energy stocks from a short-term technical standpoint. He is also the author of numerous books, including 'How to Read Chart Patterns for Greater Profits.' For more information visit www.clifdroke.com
Clif Droke Archive |
© 2005-2022 http://www.MarketOracle.co.uk - The Market Oracle is a FREE Daily Financial Markets Analysis & Forecasting online publication.


