


Time for Crude Oil Price Drop below $50?
Commodities / Crude Oil Jan 21, 2017 - 06:59 PM GMTBy: Nadia_Simmons

 Trading position (short-term; our opinion): Short positions (with a stop-loss order at $56.45 and an initial downside target at $45.81) are justified from the risk/reward perspective.
On Wednesday, crude oil lost 2.57% after the head of the IEA warned of a significant increase in U.S. shale output as OPEC and non-OPEC producers cut output. This news negatively affected the investors' sentiment and pushed the black gold under important support levels. What does it mean for light crude?
Let's examine the charts below to find out (charts courtesy of http://stockcharts.com).
Yesterday, we wrote the following:
(...) although crude oil moved higher yesterday, the red gap continues to keep gains in check. Additionally, the sell signals generated by the indicators are still in play, supporting oil bears and another attempt to move lower.
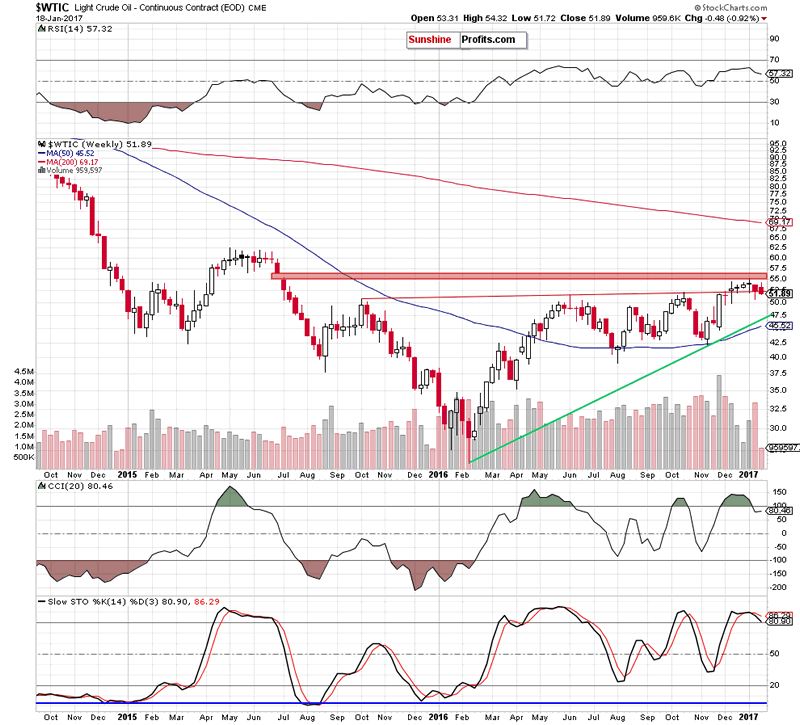
From today's point of view we see that the situation developed in line with the above scenario and crude came back below the previously-broken long-term red support/resistance line, invalidating the earlier breakout. This is a negative event, which together with the sell signals suggests further deterioration in the following days.
Having said the above let's examine the daily chart and look for more bearish factors.
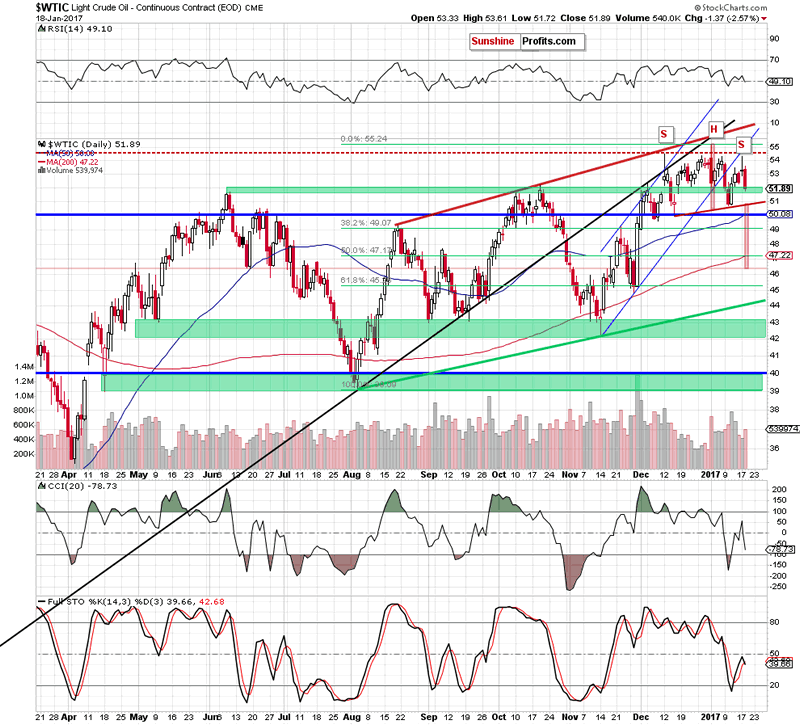
Looking at the very short-term chart, we see that crude oil extended losses and dropped under the October high. This move materialized on higher volume, which confirms the oil bears' strength. Additionally, the CCI reversed and the Stochastic Oscillator re-generated a sell signal, which suggests that what we wrote yesterday is up-to-date also today:
(...) light crude not only hit a double top, but also declined below last week's high, which doesn't bode well for the commodity.
On top of that, when we take a closer look at the daily chart, we can notice a potential head and shoulders formation. If this is the case, yesterday's move to the upside created the right shoulder of the pattern, suggesting lower prices of the black gold in the coming days.
How low could crude oil go in the near future? In our opinion, the initial downside target will be the neck line of the head and shoulders formation (around $50.89 at the moment of writing these words). If it is broken, we'll see an acceleration of declines and a drop even to around $46.36, where the size of the downward move will correspond to the height of the mentioned formation.
Before we finish today's alert we would also like to draw your attention to the relationship between the black gold and the precious metals.
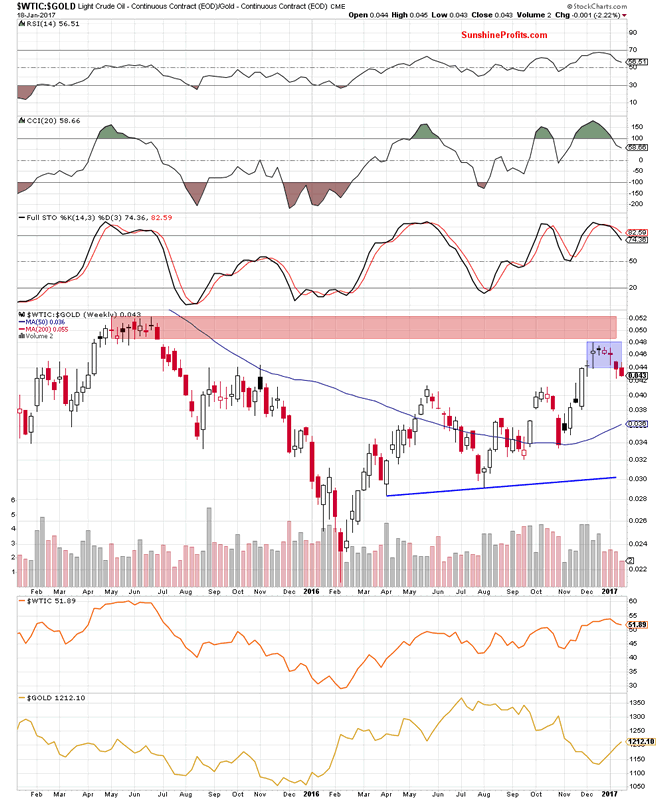
On the medium-term chart, we see that the oil-to-gold ratio declined under the lower border of the blue consolidation once again, which increases the probability of further deterioration in the coming week(s). If his is the case and we see such action, crude oil will also move lower, because the strong positive correlation between light crude and the ratio remains in place.
We can also notice one more bearish development on the medium-term chart of the oil-to-silver ratio.
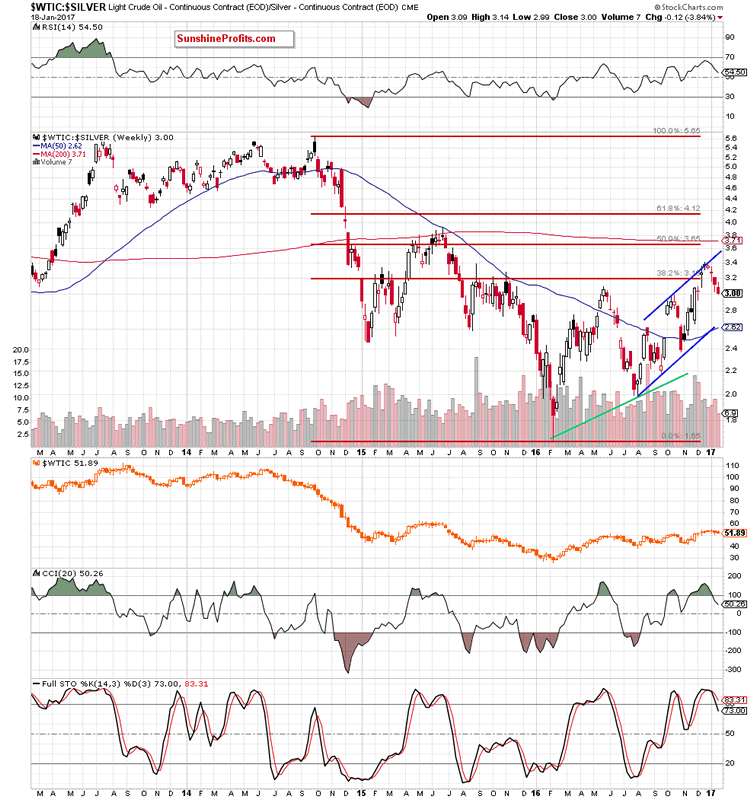
From this perspective we see that the invalidation of the breakout above the 38.2% Fibonacci retracement triggered further deterioration and a drop below last week's low, which is a negative event. Additionally, there are also the sell signals generated by the indicators, which support oil bears and lower values of the ratio and crude oil.
Summing up, short positions continue to be justified as the double top formation, the potential head and shoulders pattern and the current situation in the oil-to-gold and oil-to-silver ratios suggest further deterioration in the coming days.
Very short-term outlook: bearish
Short-term outlook: bearish
MT outlook: bearish
LT outlook: mixed
Trading position (short-term; our opinion): Short positions (with a stop-loss order at $56.45 and an initial downside target at $45.81) are justified from the risk/reward perspective.
Thank you.
Nadia Simmons
Forex & Oil Trading Strategist
Przemyslaw Radomski
Founder, Editor-in-chief
Sunshine Profits: Gold & Silver, Forex, Bitcoin, Crude Oil & Stocks
Stay updated: sign up for our free mailing list today
* * * * *
Disclaimer
All essays, research and information found above represent analyses and opinions of Nadia Simmons and Sunshine Profits' associates only. As such, it may prove wrong and be a subject to change without notice. Opinions and analyses were based on data available to authors of respective essays at the time of writing. Although the information provided above is based on careful research and sources that are believed to be accurate, Nadia Simmons and his associates do not guarantee the accuracy or thoroughness of the data or information reported. The opinions published above are neither an offer nor a recommendation to purchase or sell any securities. Nadia Simmons is not a Registered Securities Advisor. By reading Nadia Simmons’ reports you fully agree that he will not be held responsible or liable for any decisions you make regarding any information provided in these reports. Investing, trading and speculation in any financial markets may involve high risk of loss. Nadia Simmons, Sunshine Profits' employees and affiliates as well as members of their families may have a short or long position in any securities, including those mentioned in any of the reports or essays, and may make additional purchases and/or sales of those securities without notice.
© 2005-2022 http://www.MarketOracle.co.uk - The Market Oracle is a FREE Daily Financial Markets Analysis & Forecasting online publication.