When Did The Fed Start Buying Stocks? - Indications Are When 'Taper' Ended!
Stock-Markets / Stock Market 2017 Jan 26, 2017 - 03:25 PM GMTBy: Gordon_T_Long
 We see the forensic "finger prints" all over the economic and financial data that the Federal Reserve through a proxy likely Citadel Capital (or the Fed's CBOE Volume Options Agreement) has highly likely been buying the US equity market since its QE 3 "TAPER" ended in October 2014. We do know for a fact that the BOJ, SNB, PBOC, Norwegian and other central banks have been doing this as matter of normal monetary policy for some time and that 80% of all these central banks said they plan on buying more stocks this year. Why not the Federal Reserve? To see the forensic economic evidence more clearly, consider the following US indicators:
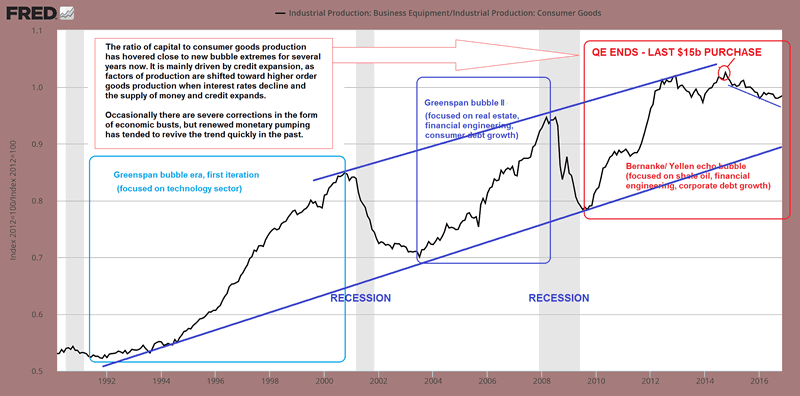
Ratio of Capital Goods To Consumer Production
Pater Tenebrarum via Acting-Man.com points out, the ratio of capital goods to consumer goods production is a reflection of the policy-driven credit bubbles of recent decades. We have annotated his chart below to show more clearly both the "control channel" underway since the Greenspan era, as well as the late 2014 QE "TAPER" ending "inflection point". Tenebrarum reports:

Currently the ratio is in a sideways channel at an extremely high level, as strong money supply growth and credit expansion have continued almost unabated since 2008. There is a natural limit to this trend though, provided the central bank does not opt for extreme inflation (we currently assume that it won't, but this assessment may have to be changed in the future).
There is a strong and not exactly unreasonable suspicion that most of the economic policies favored by the Trump administration (at least some of which will presumably be backed by the Republican-controlled legislature) are likely to push price inflation up. Higher government spending, tariff hikes, the possible deportation of cheap illegal workers, etc., are all deemed to lead to higher consumer prices.
Keep in mind in this context that the inter-temporal price distortions along the production structure triggered by the Fed's loose monetary policy in recent years are fated to eventually shift and reverse anyway.
Resources have been miscalculated as too much has been invested in the higher stages of the economy's capital structure relative to the lower stages.
Eventually a bottleneck should emerge in terms of the demand for and supply of final goods, in conjunction with hitherto suppressed natural interest rates reasserting their influence on market rates.
The problem is that the real savings needed to support and maintain a lengthened production structure never existed – they were an illusion created by the printing press. The same holds for the decline in consumer demand implied by an increase in savings – it simply hasn't happened (at least not to the extent indicated by market interest rates). The real funding for long term investment projects still needs to come from somewhere though.
It such investments are not supported by an increase in real savings, capital will be consumed. The falsification of economic calculation engendered by prices that have been distorted by credit expansion inter alia leads to the reporting of illusory accounting profits – later it turns out that capital maintenance has been lacking and the previously reported profits turn into very large losses (think about 2008/2009 as the most recent example of such an "unmasking"). At some point the capital consumption will be reflected by a surge in market interest rates and a shift in prices. Many of Trump's policy proposals (if implemented) are likely to hasten this process, ceteris paribus.
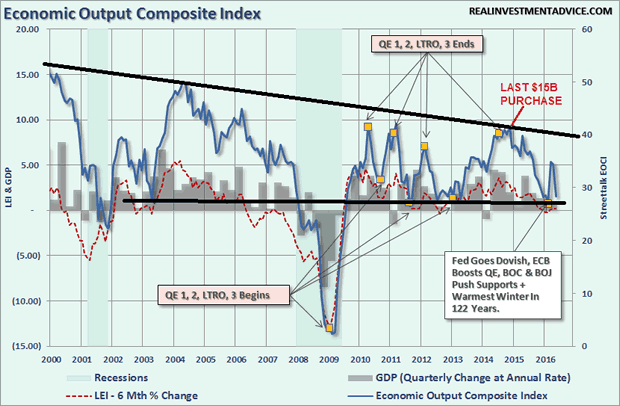
Economic Output Composite Index
The following chart is from Lance Roberts which we have also taken the liberty to mark-up. here we can see the impact of the Fed ending its various programs and then being forced to start yet another program to keep the US Economic engine from stalling and plunging the US into a recession -- or worse! On the surface it would appear that after QE "TAPER" ended the Fed completely moved to the sidelines.
But is this in fact the case?

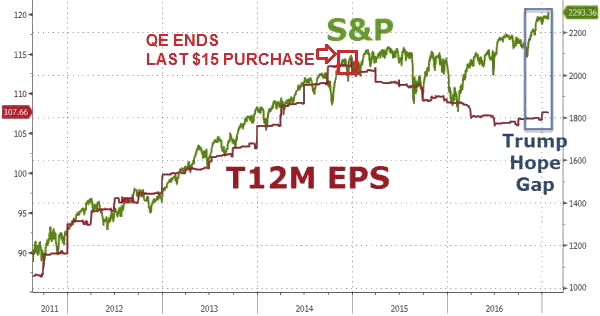
Earning Divergence
At precisely the end of the QE "TAPER" program we again witness another inflection point. This time it is the divergence of the S&P 500 from earnings as measured by the 12 month trailing EPS.
Something or someone began supporting and lifting the market at the end of the Fed's QE "TAPER" program.
Who would have had the motive, money and means to do this - and also chose this timing to do it???

Circumstantial evidence? I suspect the court of public opinion would return a conviction.
Federal Reserve Programs
We have been expecting this type of Fed action and suspected it was occurring for some time, especially after Janet Yellen suggested this as a real possibility and "benefit" in September 2016.
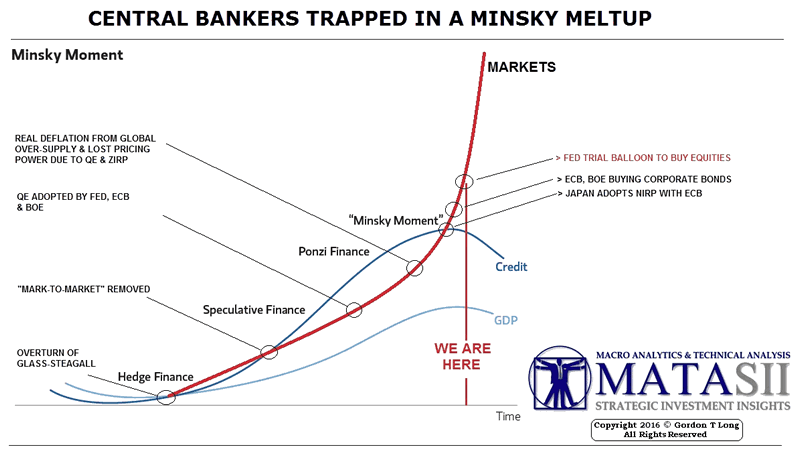
If this is in fact the case, it will become more pronounced going forward and drive the markets potentially into "Minsky" type melt-up.

For more articles signup for GordonTLong.com releases of MATASII Research
Gordon T. Long
Publisher - LONGWave
Signup for notification of the next MACRO INSIGHTS
Request your FREE TWO MONTH TRIAL subscription of the Market Analytics and Technical Analysis (MATA) Report. No Obligations. No Credit Card.
Gordon T Long is not a registered advisor and does not give investment advice. His comments are an expression of opinion only and should not be construed in any manner whatsoever as recommendations to buy or sell a stock, option, future, bond, commodity or any other financial instrument at any time. While he believes his statements to be true, they always depend on the reliability of his own credible sources. Of course, he recommends that you consult with a qualified investment advisor, one licensed by appropriate regulatory agencies in your legal jurisdiction, before making any investment decisions, and barring that you are encouraged to confirm the facts on your own before making important investment commitments. © Copyright 2013 Gordon T Long. The information herein was obtained from sources which Mr. Long believes reliable, but he does not guarantee its accuracy. None of the information, advertisements, website links, or any opinions expressed constitutes a solicitation of the purchase or sale of any securities or commodities. Please note that Mr. Long may already have invested or may from time to time invest in securities that are recommended or otherwise covered on this website. Mr. Long does not intend to disclose the extent of any current holdings or future transactions with respect to any particular security. You should consider this possibility before investing in any security based upon statements and information contained in any report, post, comment or suggestions you receive from him.
Copyright © 2010-2017 Gordon T. Long
Gordon T Long Archive |
© 2005-2022 http://www.MarketOracle.co.uk - The Market Oracle is a FREE Daily Financial Markets Analysis & Forecasting online publication.


